Analytics Dashboard
Overview
AccelByte Cloud's Analytics Dashboard provides dynamic visualizations of key player metrics such as Monthly Active Users, Peak Active Users, Retention, Stickiness, and more. These metrics measure both short and long term patterns, and can be analyzed to help inform business decisions.
Metrics
AccelByte Cloud's Analytics dashboard can display data from any namespace in your environment. When you choose to view data in the publisher namespace, the data will be a culmination of all of the data from all of the game namespaces in your environment. To learn more about namespaces, see the Namespace documentation. Here are the metrics shown in the Analytics Dashboard:
NOTE
When you view analytics data in your publisher namespace, only unique players will be counted, so players of multiple games won't be counted multiple times.
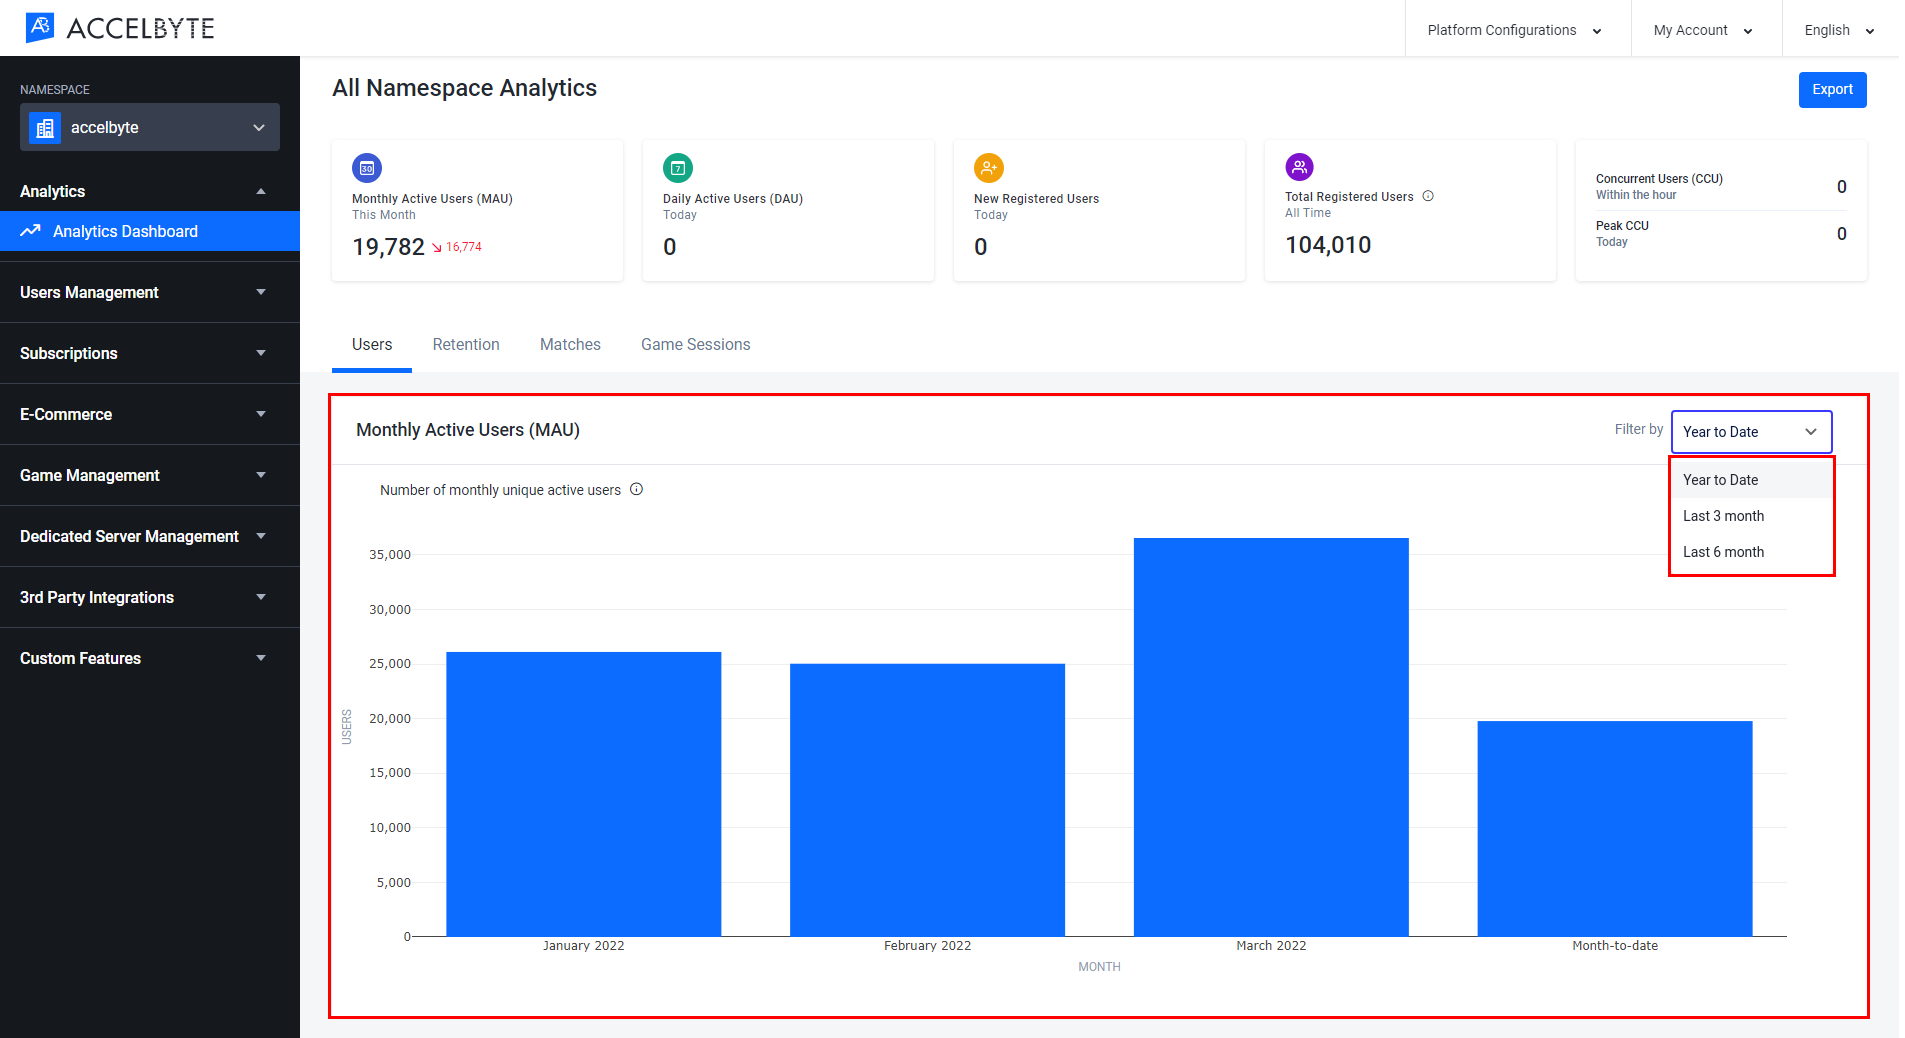
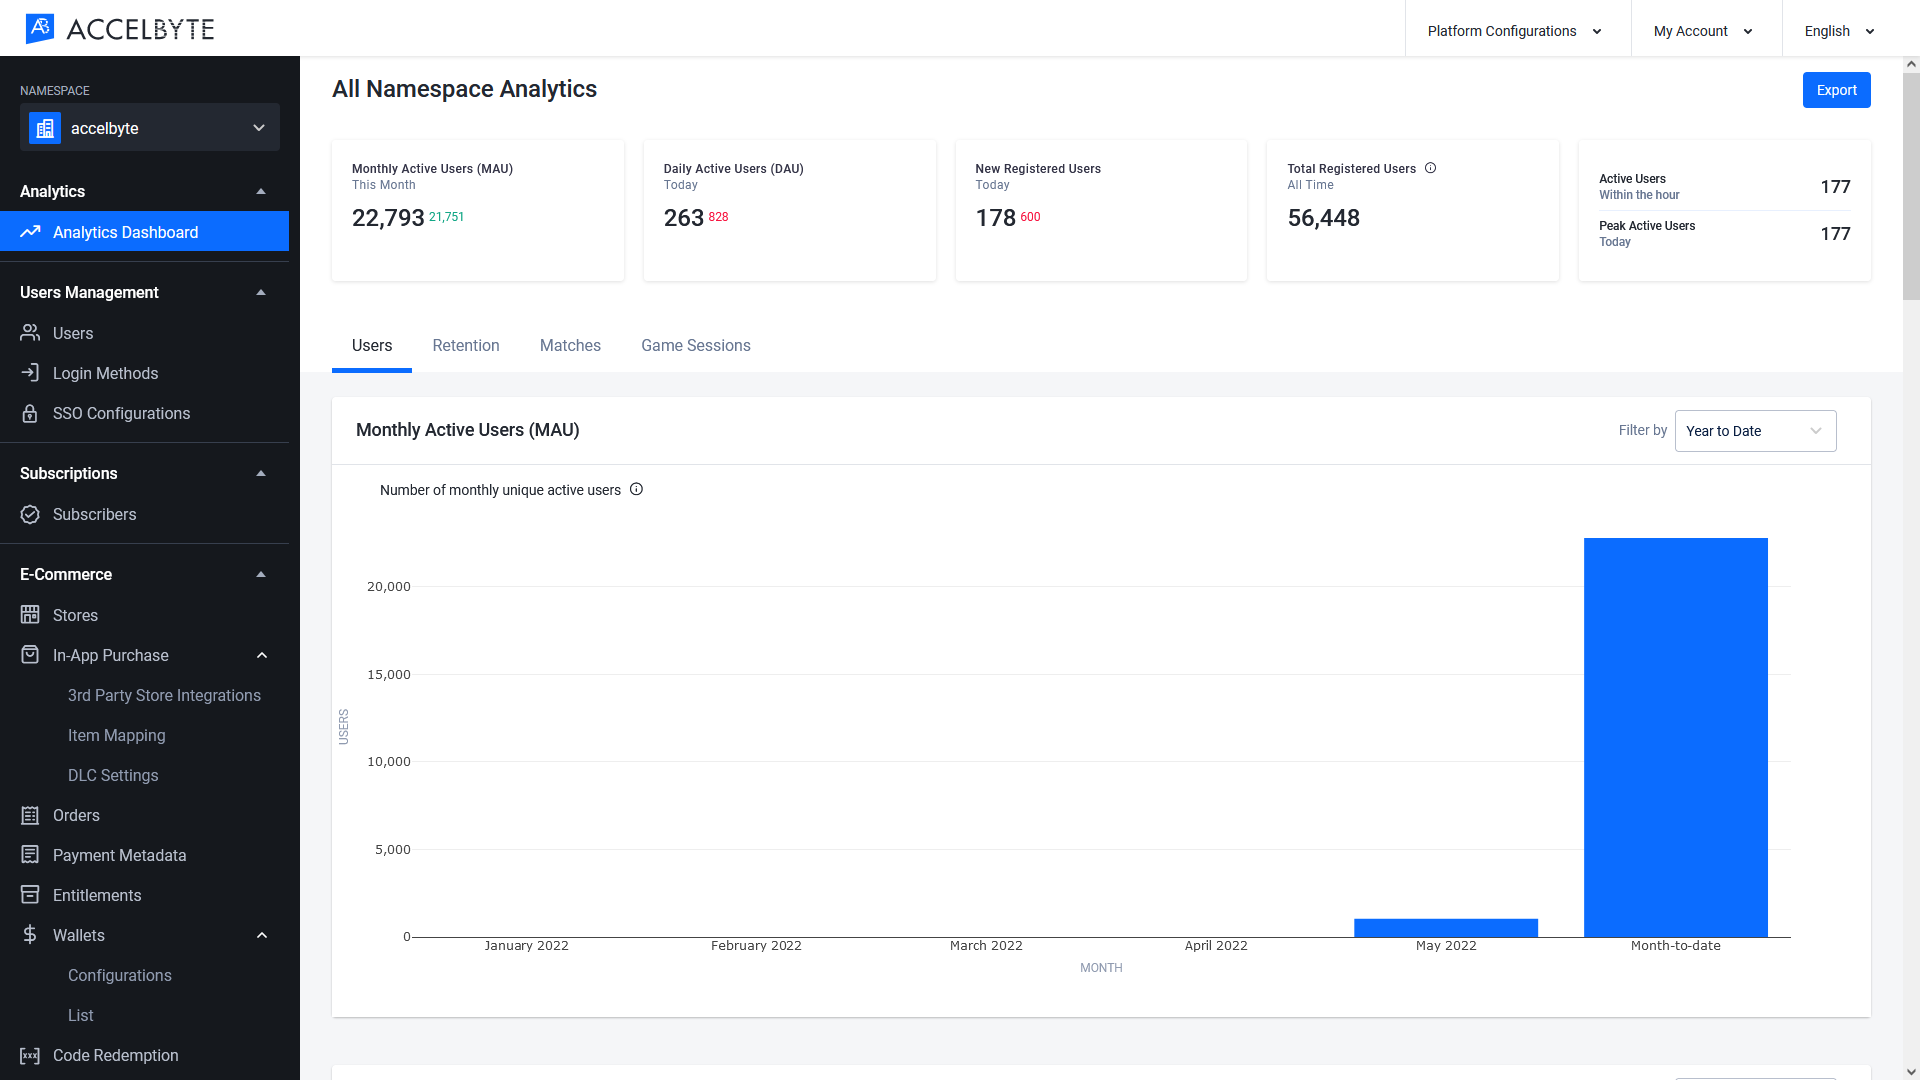
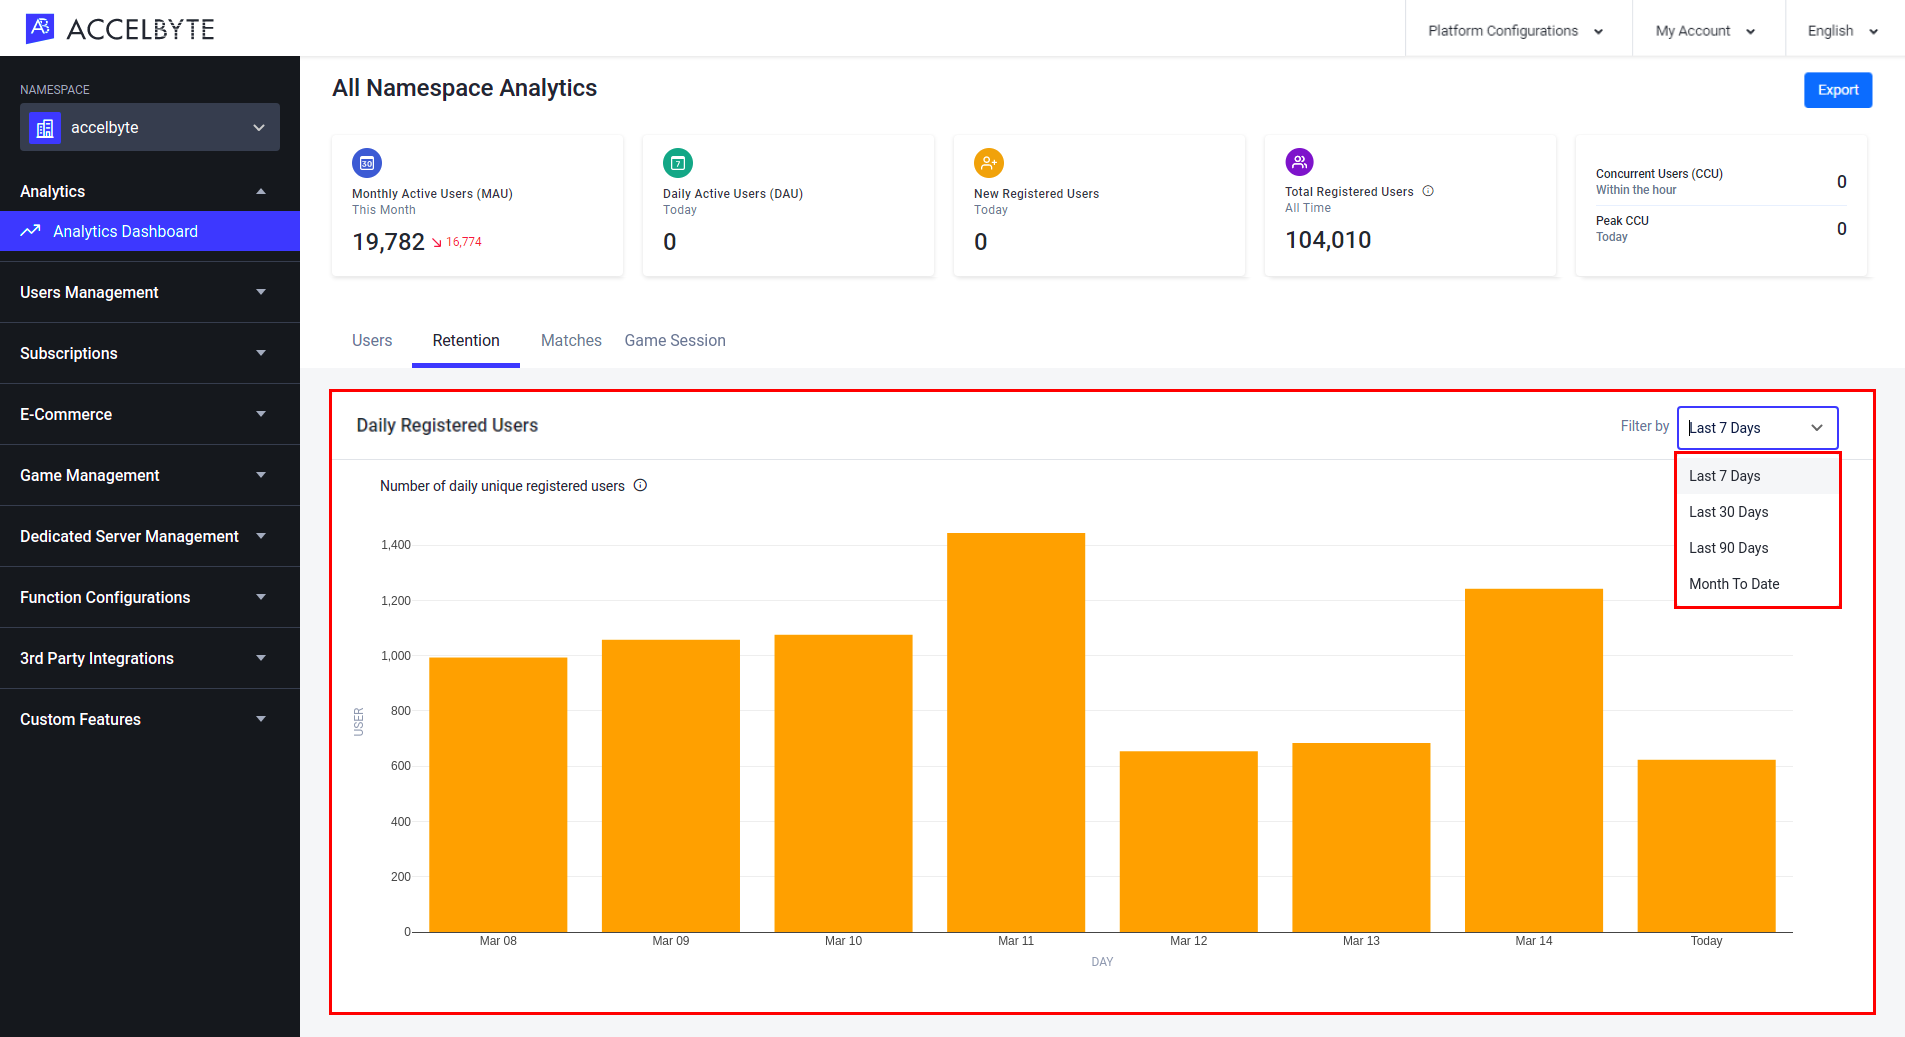
Monthly Active Users (MAU)
The Monthly Active Users (MAU) value shows the number of unique active players on your platform in the current month.

NOTE
Green or red numbers on the right-hand side of the metrics show the difference between the current month's metric and the previous month's. Green means that the current value is higher than the previous month, while red means that the current value is lower.
The Monthly Active Users (MAU) bar graph in the Users tab below displays the MAU of every month of the current year, or of the last three or six months. You can switch between these options by selecting Year to Date, Last 3 Months, or Last 6 Months from the dropdown menu in the top-right corner of the panel.
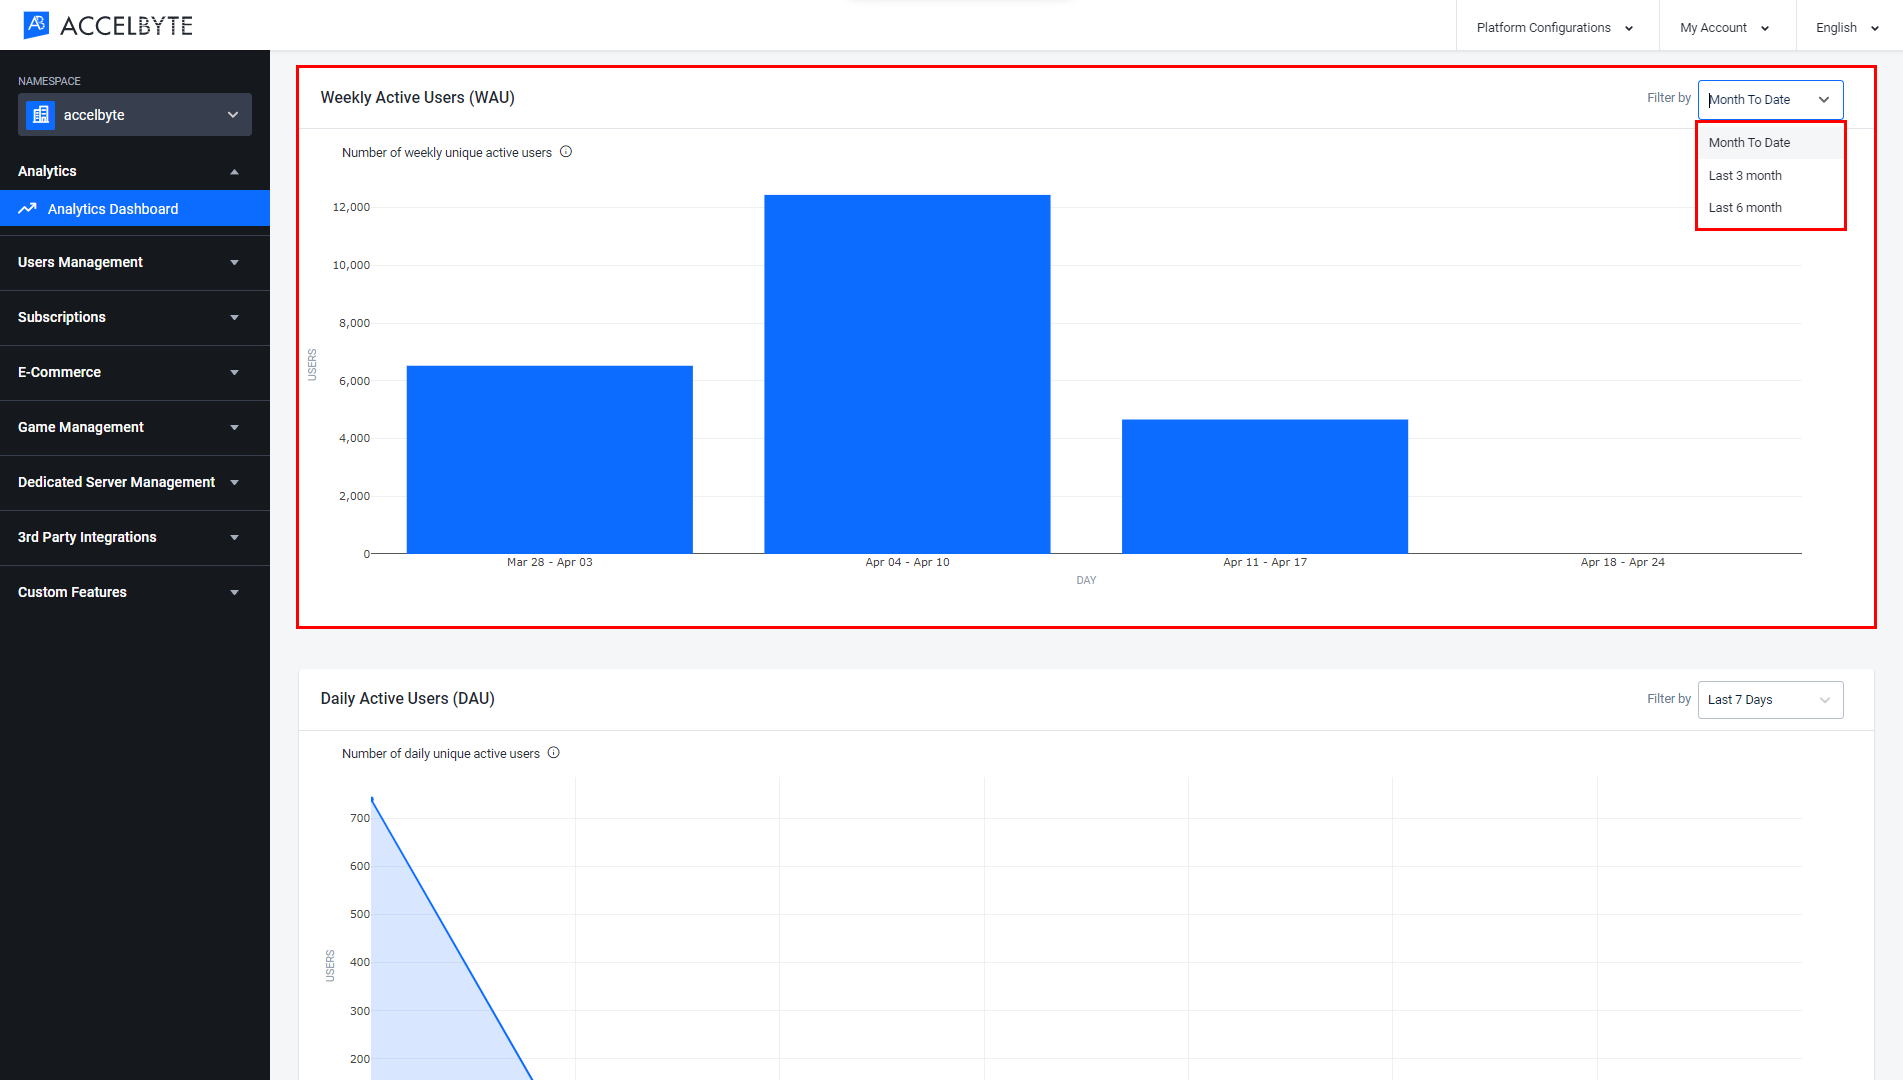
Weekly Active Users (WAU)
The Weekly Active Users (WAU) bar graph in the Users tab below displays the WAU of every week of the current month, last three months, or last six months. You can switch between these options by selecting either Month to Date, Last 3 Months, or Last 6 Months from the dropdown menu in the top-right corner of the panel.
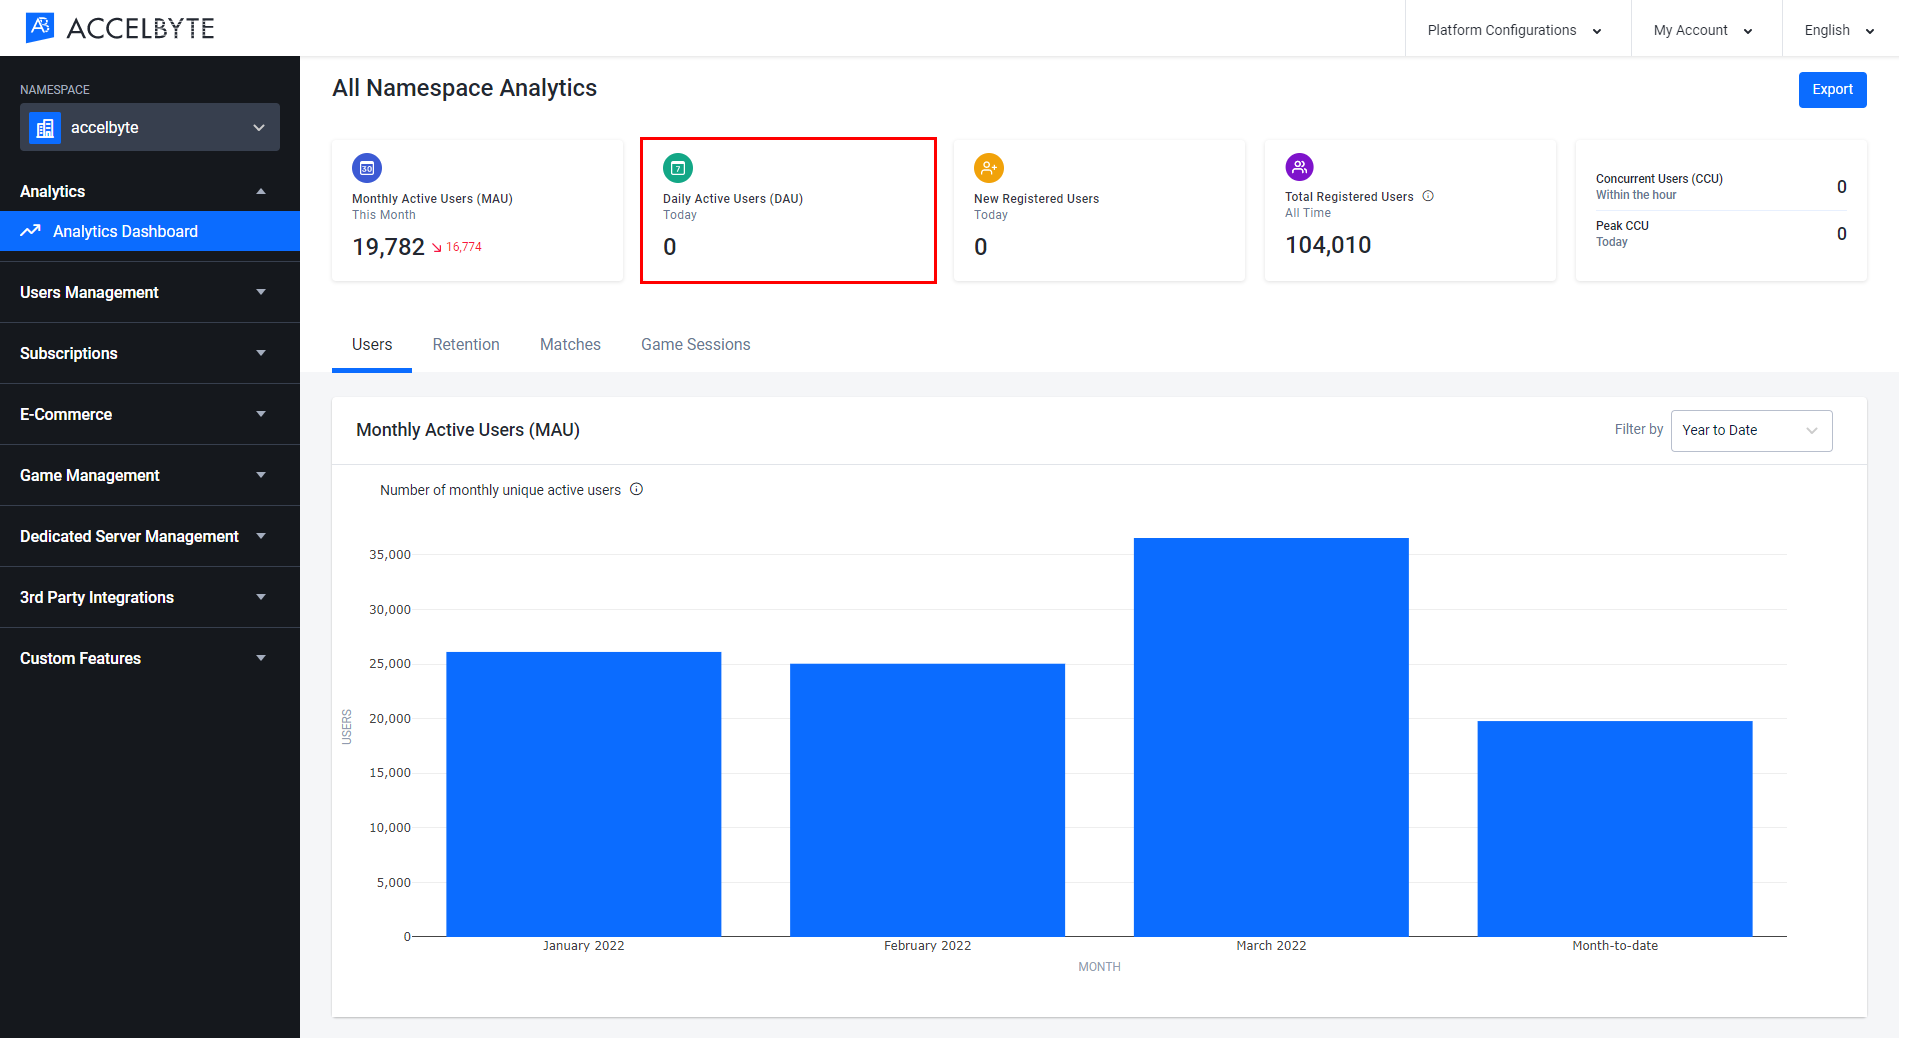
Daily Active Users (DAU)
The Daily Active Users (DAU) value at the top of the page shows the number of active players on your platform today.
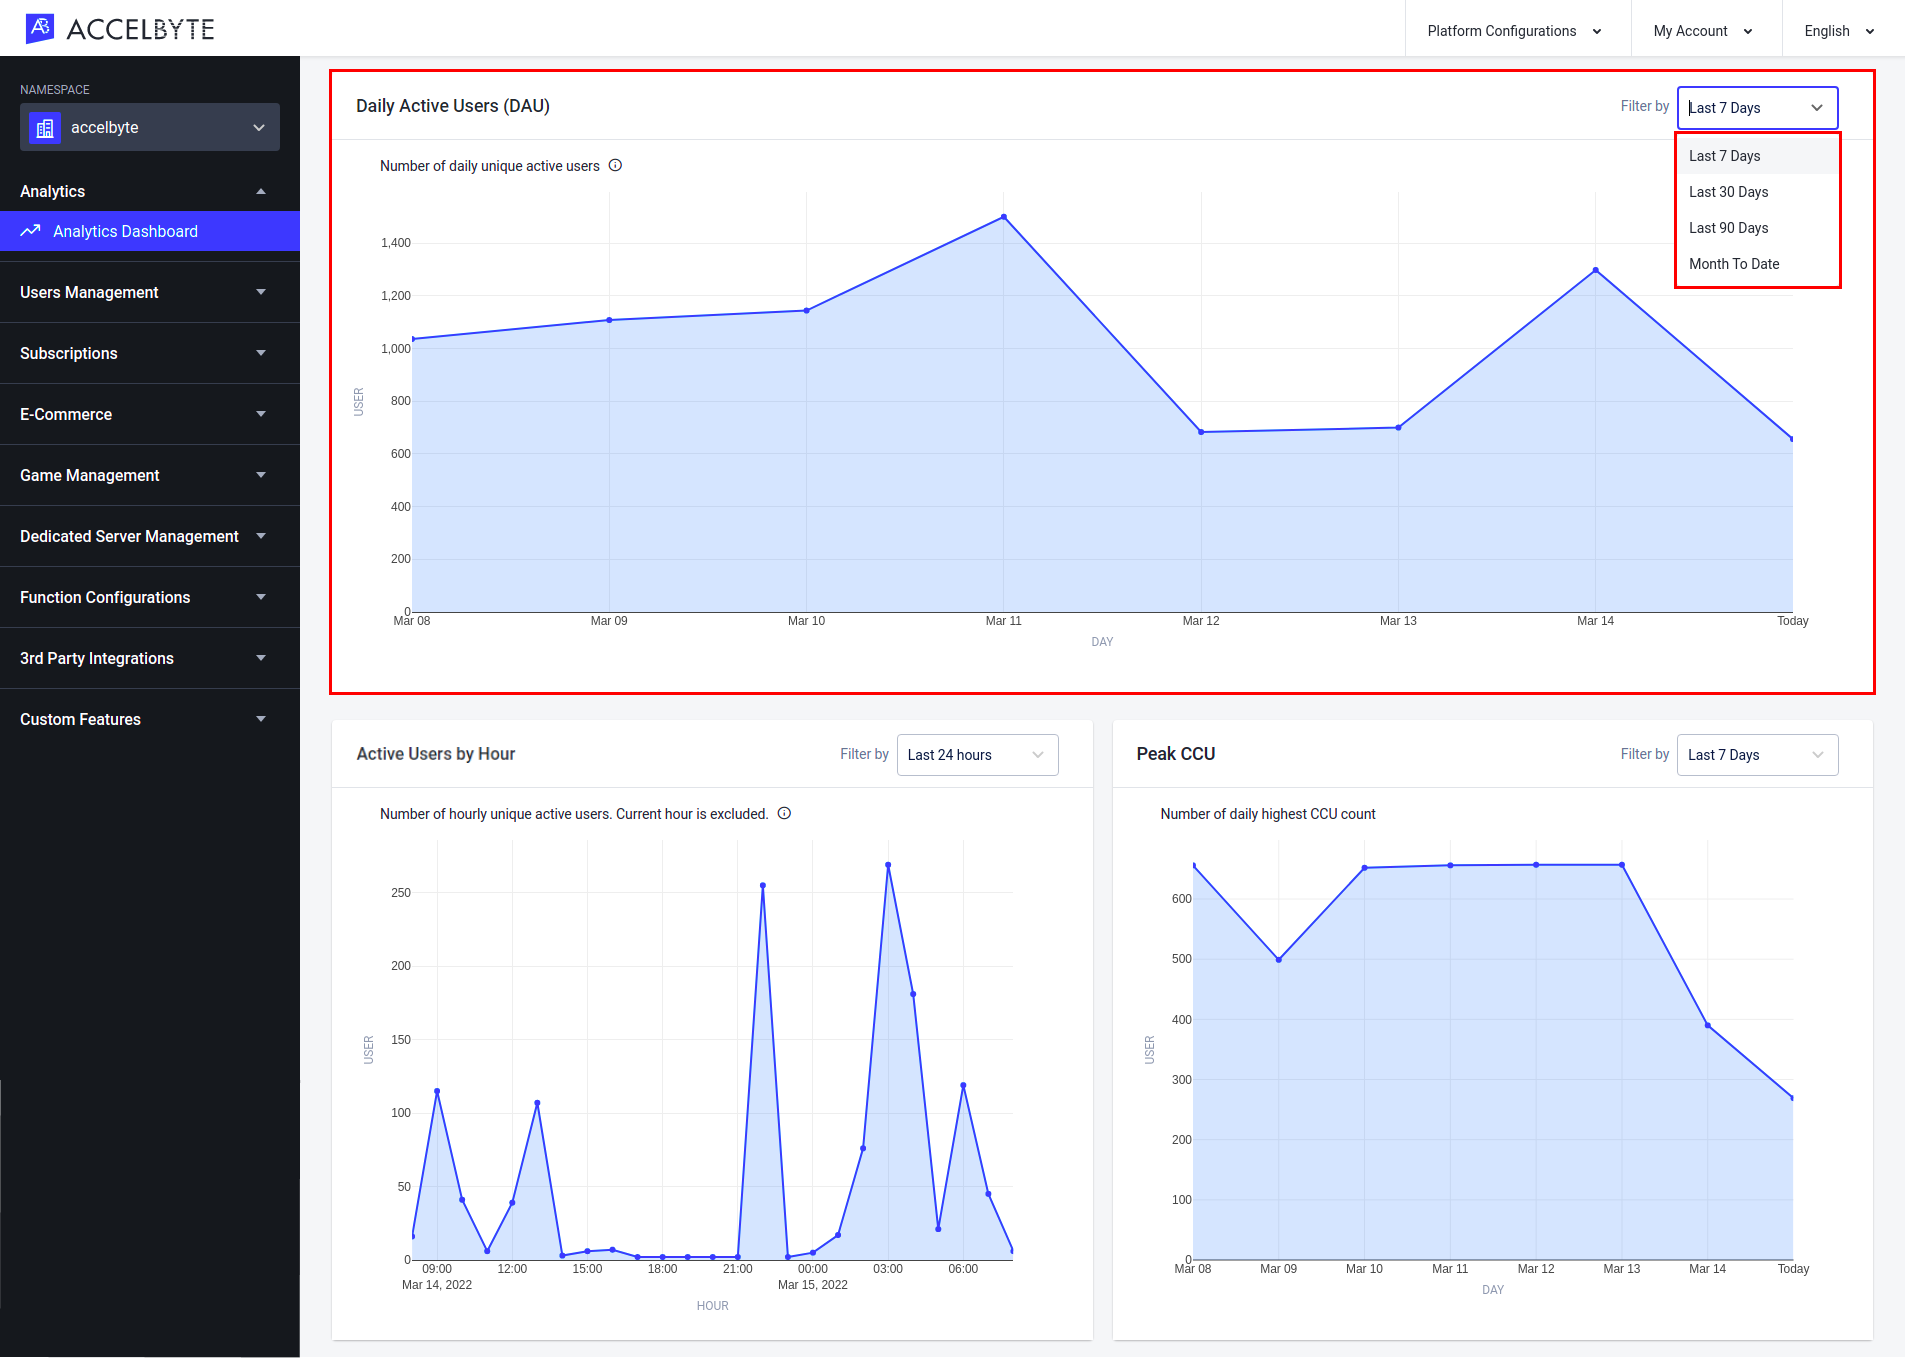
The Daily Active Users (DAU) line graph in the Users tab below displays the DAU from the last 7, 30, or 90 days, or from the current month. You can switch between these options by selecting Last 7 Days, Last 30 Days, Last 90 Days, or Month to Date from the dropdown menu in the top-right corner of the panel.
New Registered Users
The New Registered Users value at the top of the page shows the number of new players that have registered today.

Total Registered Users
The Total Registered Users value at the top of the page shows the total number of players that have ever registered with your game.

Active Users (CCU)
The Active Users value at the top of the page shows the number of players that have been active in the past hour.

Active Users by Hour
The Active Users by Hour line graph in the Users tab shows CCU by hour (excluding the current hour) for up to the last three days. You can switch between these options by selecting Last 24 Hours, Last 48 Hours, or Last 72 Hours from the dropdown menu in the top-right corner of the panel.
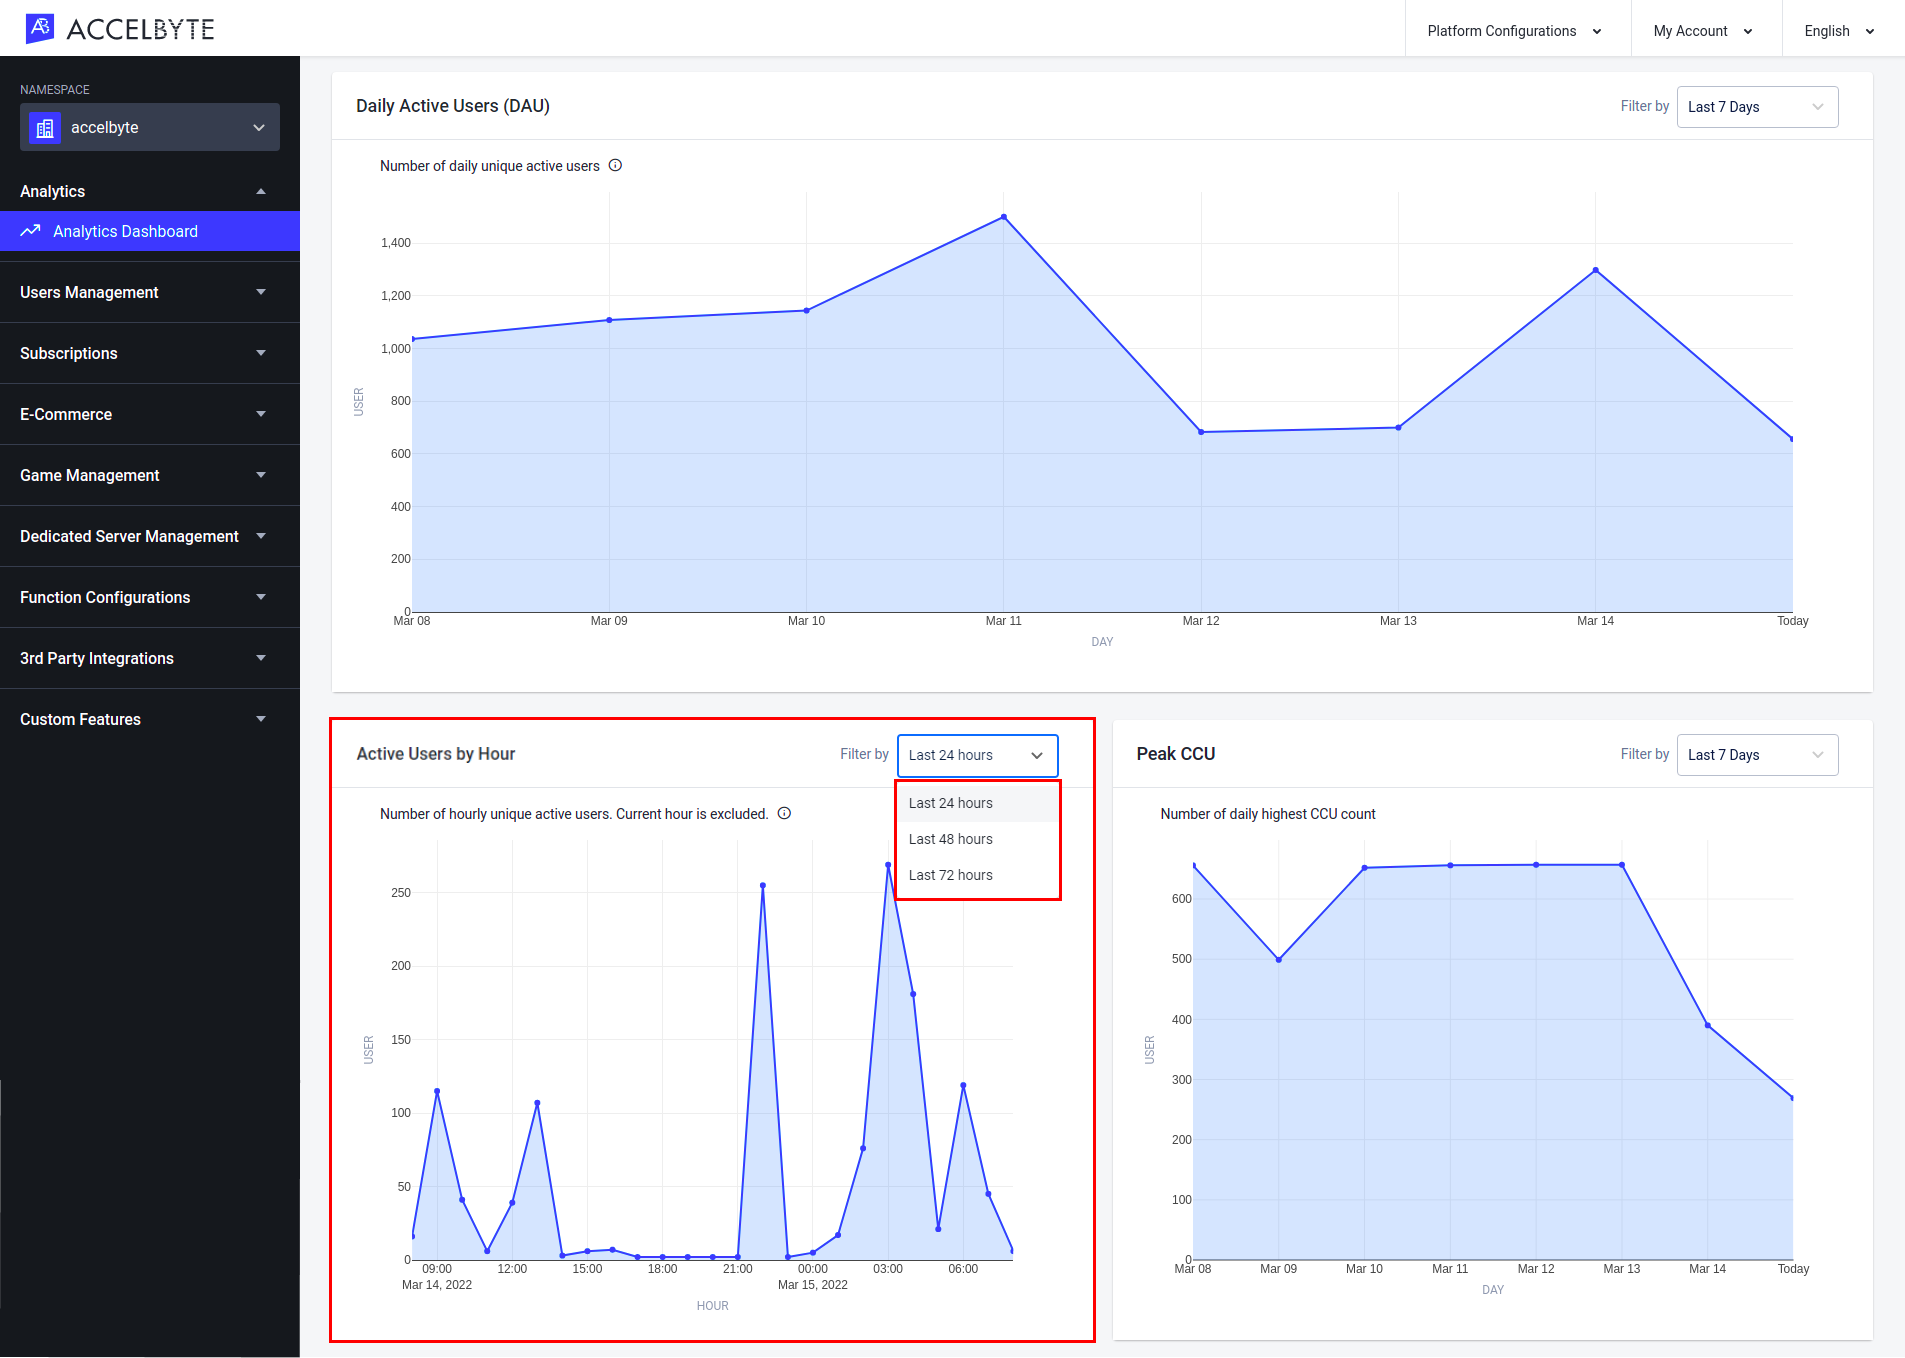
Peak Active Users
The Peak Active Users value at the top of the page shows the highest number of concurrently active players today.
The Peak Active Users line graph in the Users tab shows the peak active users from each day of the last 7, 30, or 90 days, or of the current month. You can switch between these options by selecting either Last 7 Days, Last 30 Days, Last 90 Days, or Month to Date from the dropdown menu in the top-right corner of the panel.
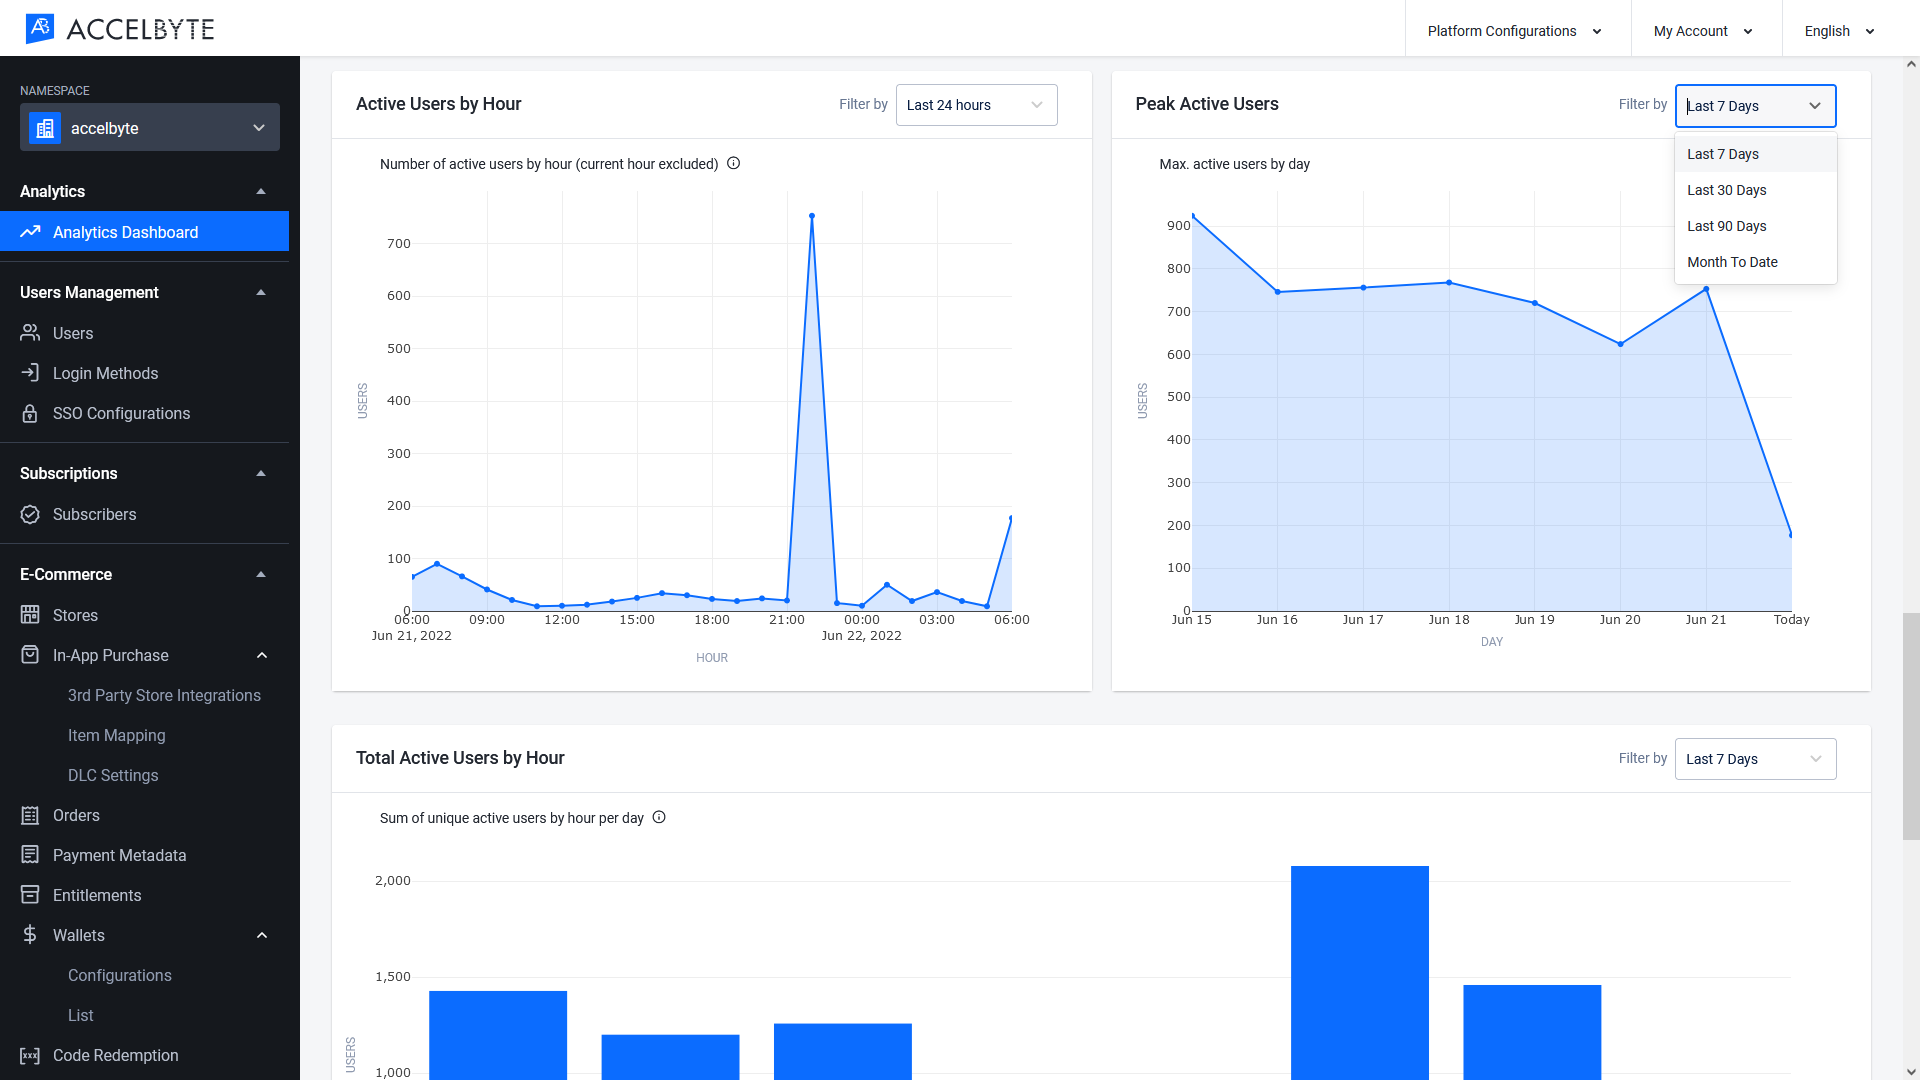
Total Active Users by Hour
The Total Active Users by Hour bar graph in the Users tab shows the total number of active players per hour per day from the last 7, 30, or 90 days, or from the current month. You can switch between these options by selecting either Last 7 Days, Last 30 Days, Last 90 Days, or Month to Date from the dropdown menu in the top-right corner of the panel.
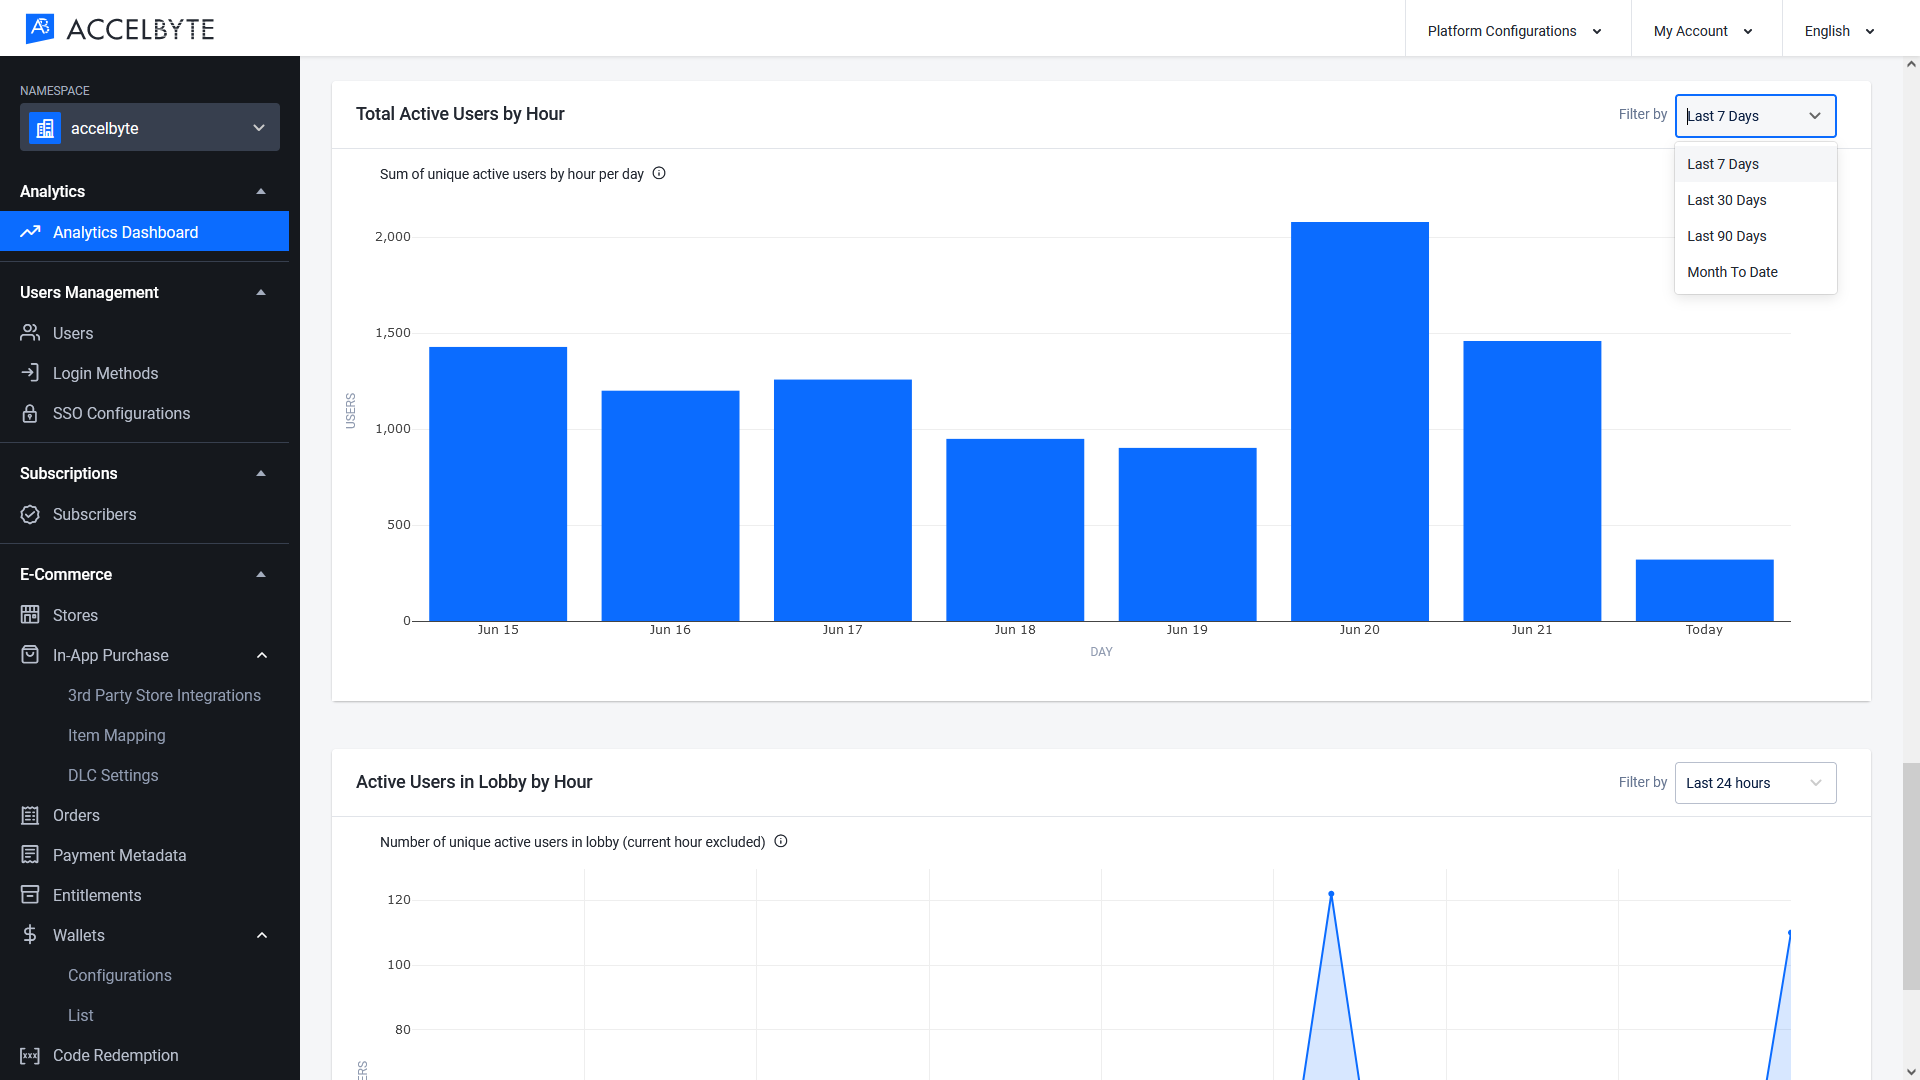
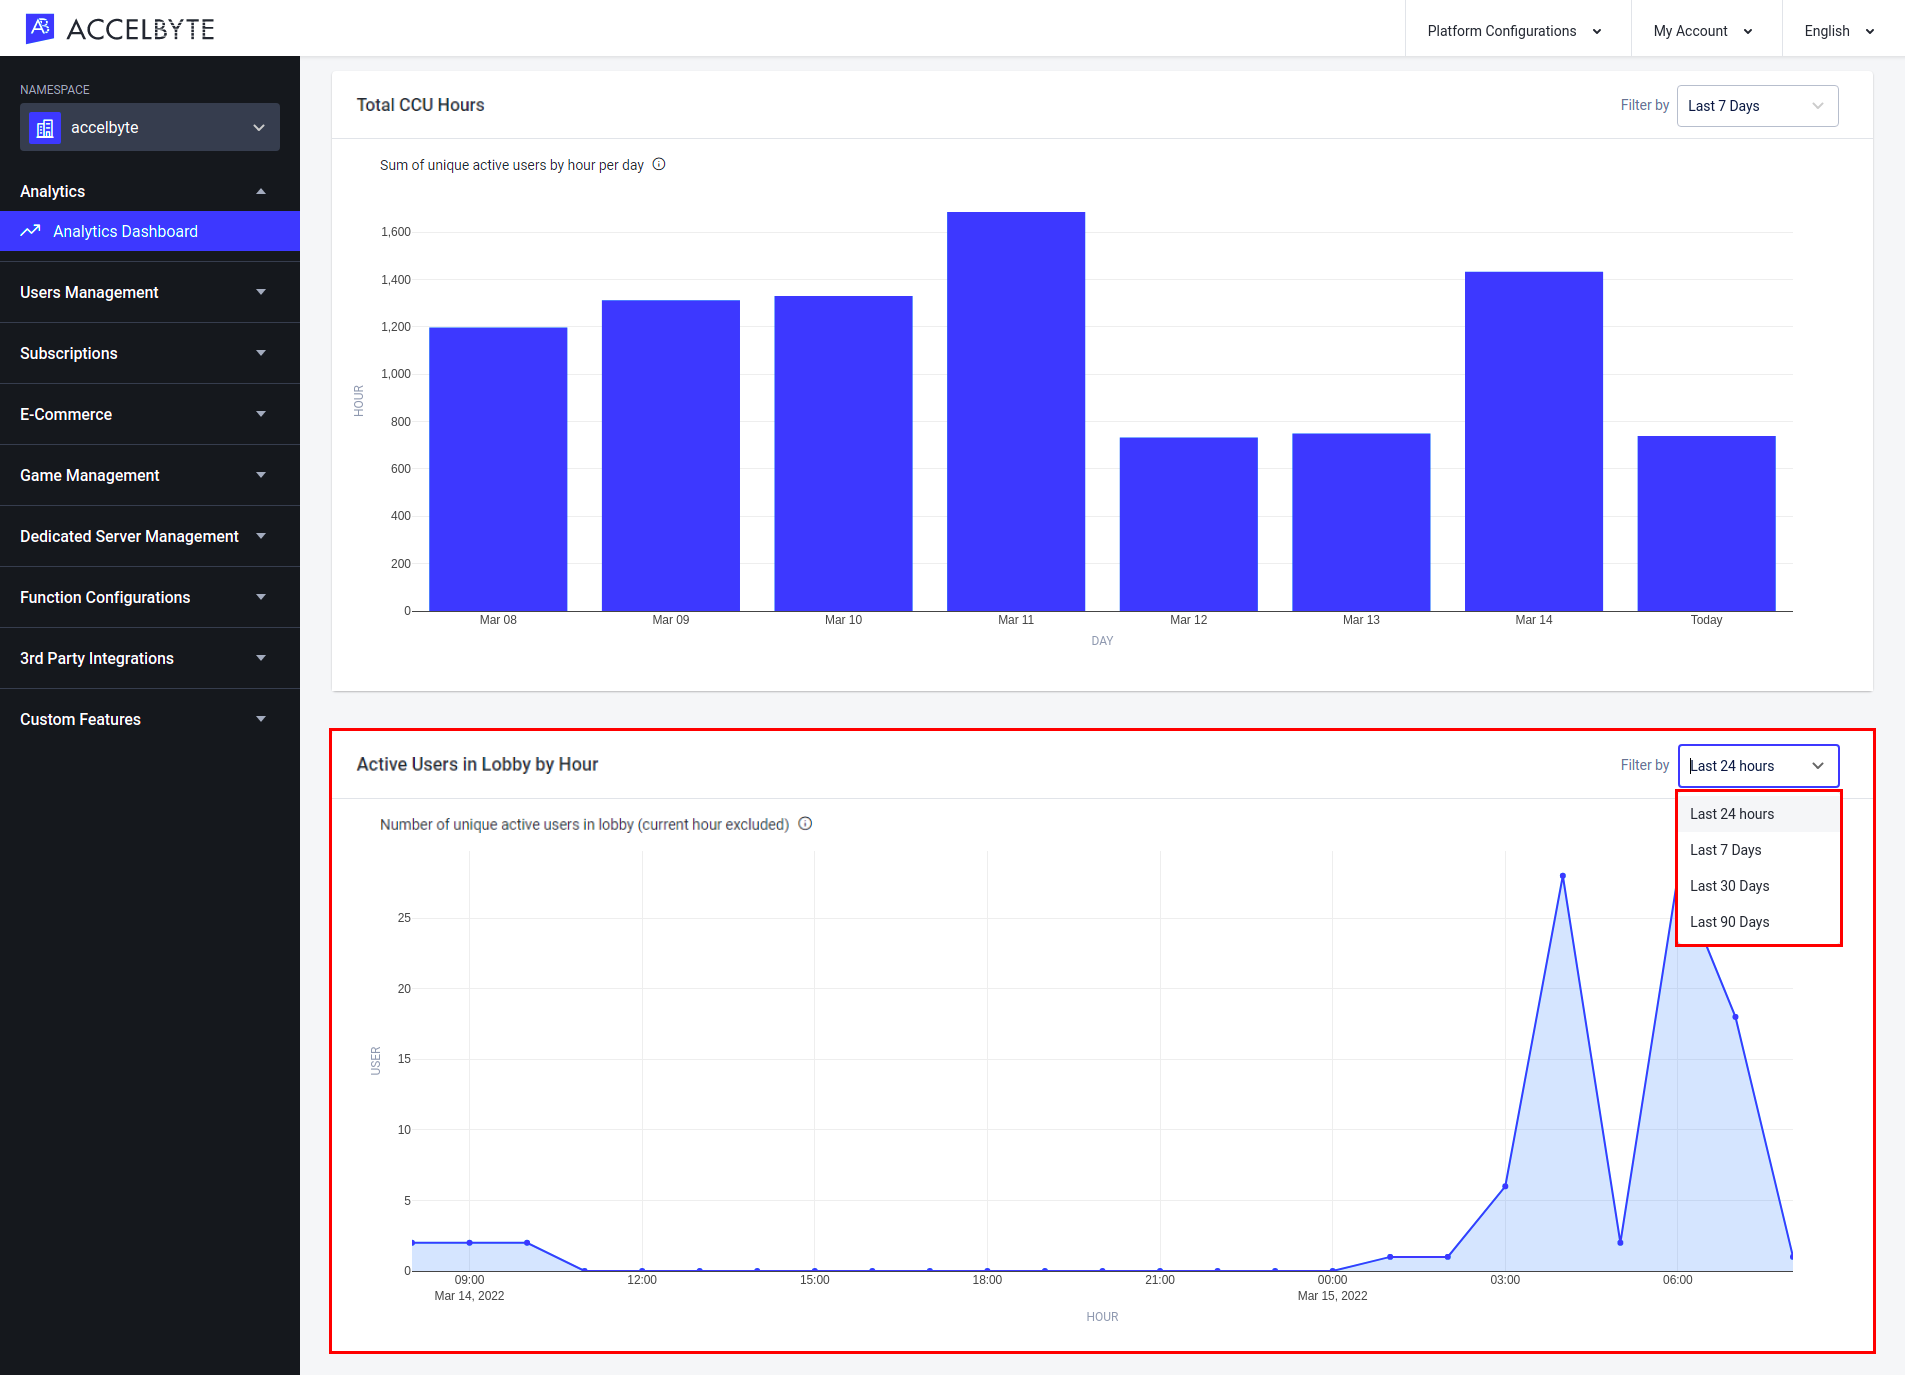
Active Users in Lobby by Hour
The Active Users in Lobby by Hour line graph in the Users tab shows the number of active players in the Lobby per hour for the last 24 hours, 7 days, 30 days, or 90 days. You can switch between these options by choosing Last 24 Hours, Last 7 Days, Last 30 Days, or Last 90 Days from the dropdown menu in the top-right corner of the panel.
Daily Registered Users
The Daily Registered Users bar graph in the Retention tab shows how many new players registered to your game per day in the last 7, 30, or 90 days, or during the current month. You can switch between these options by selecting Last 7 Days, Last 30 Days, Last 90 Days, or Month to Date from the dropdown menu in the top-right corner of the panel.
Stickiness
The Stickiness line graph in the Retention tab shows the average number of DAU from the past 30 days divided by the number of MAU. This data is shown in a 30-day time series covering the current year. For example, if today is October 30th, the most recent data point will include data from October 1st-30th, the previous data point will include data from September 1st-30th, and so on.
This metric shows you how many days the average player plays your game in a month. For example, a stickiness value of 50% means that the average player played your game for 15 out of 30 days.
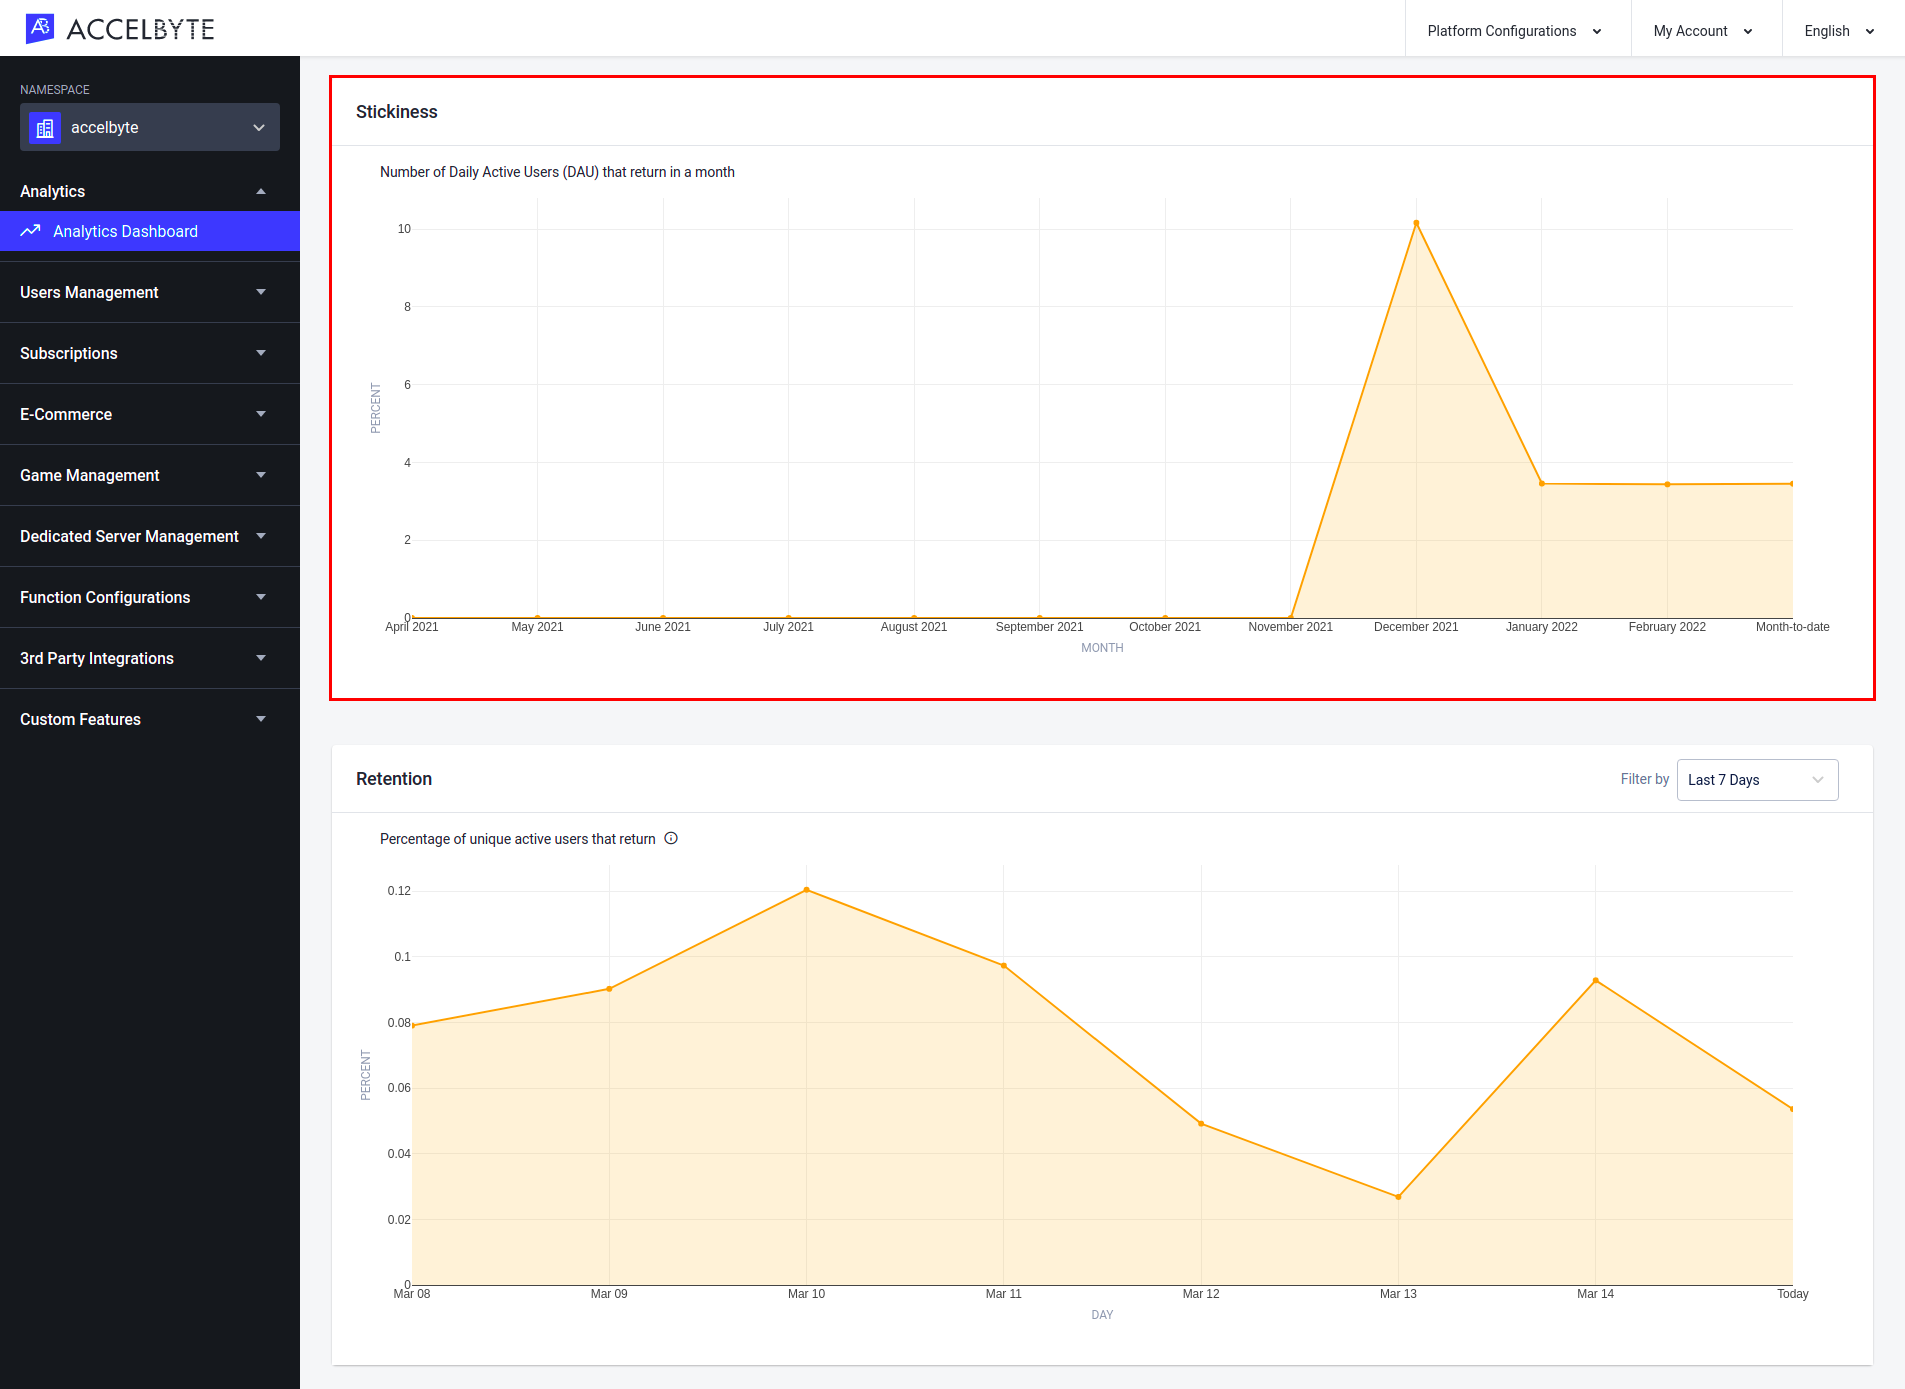
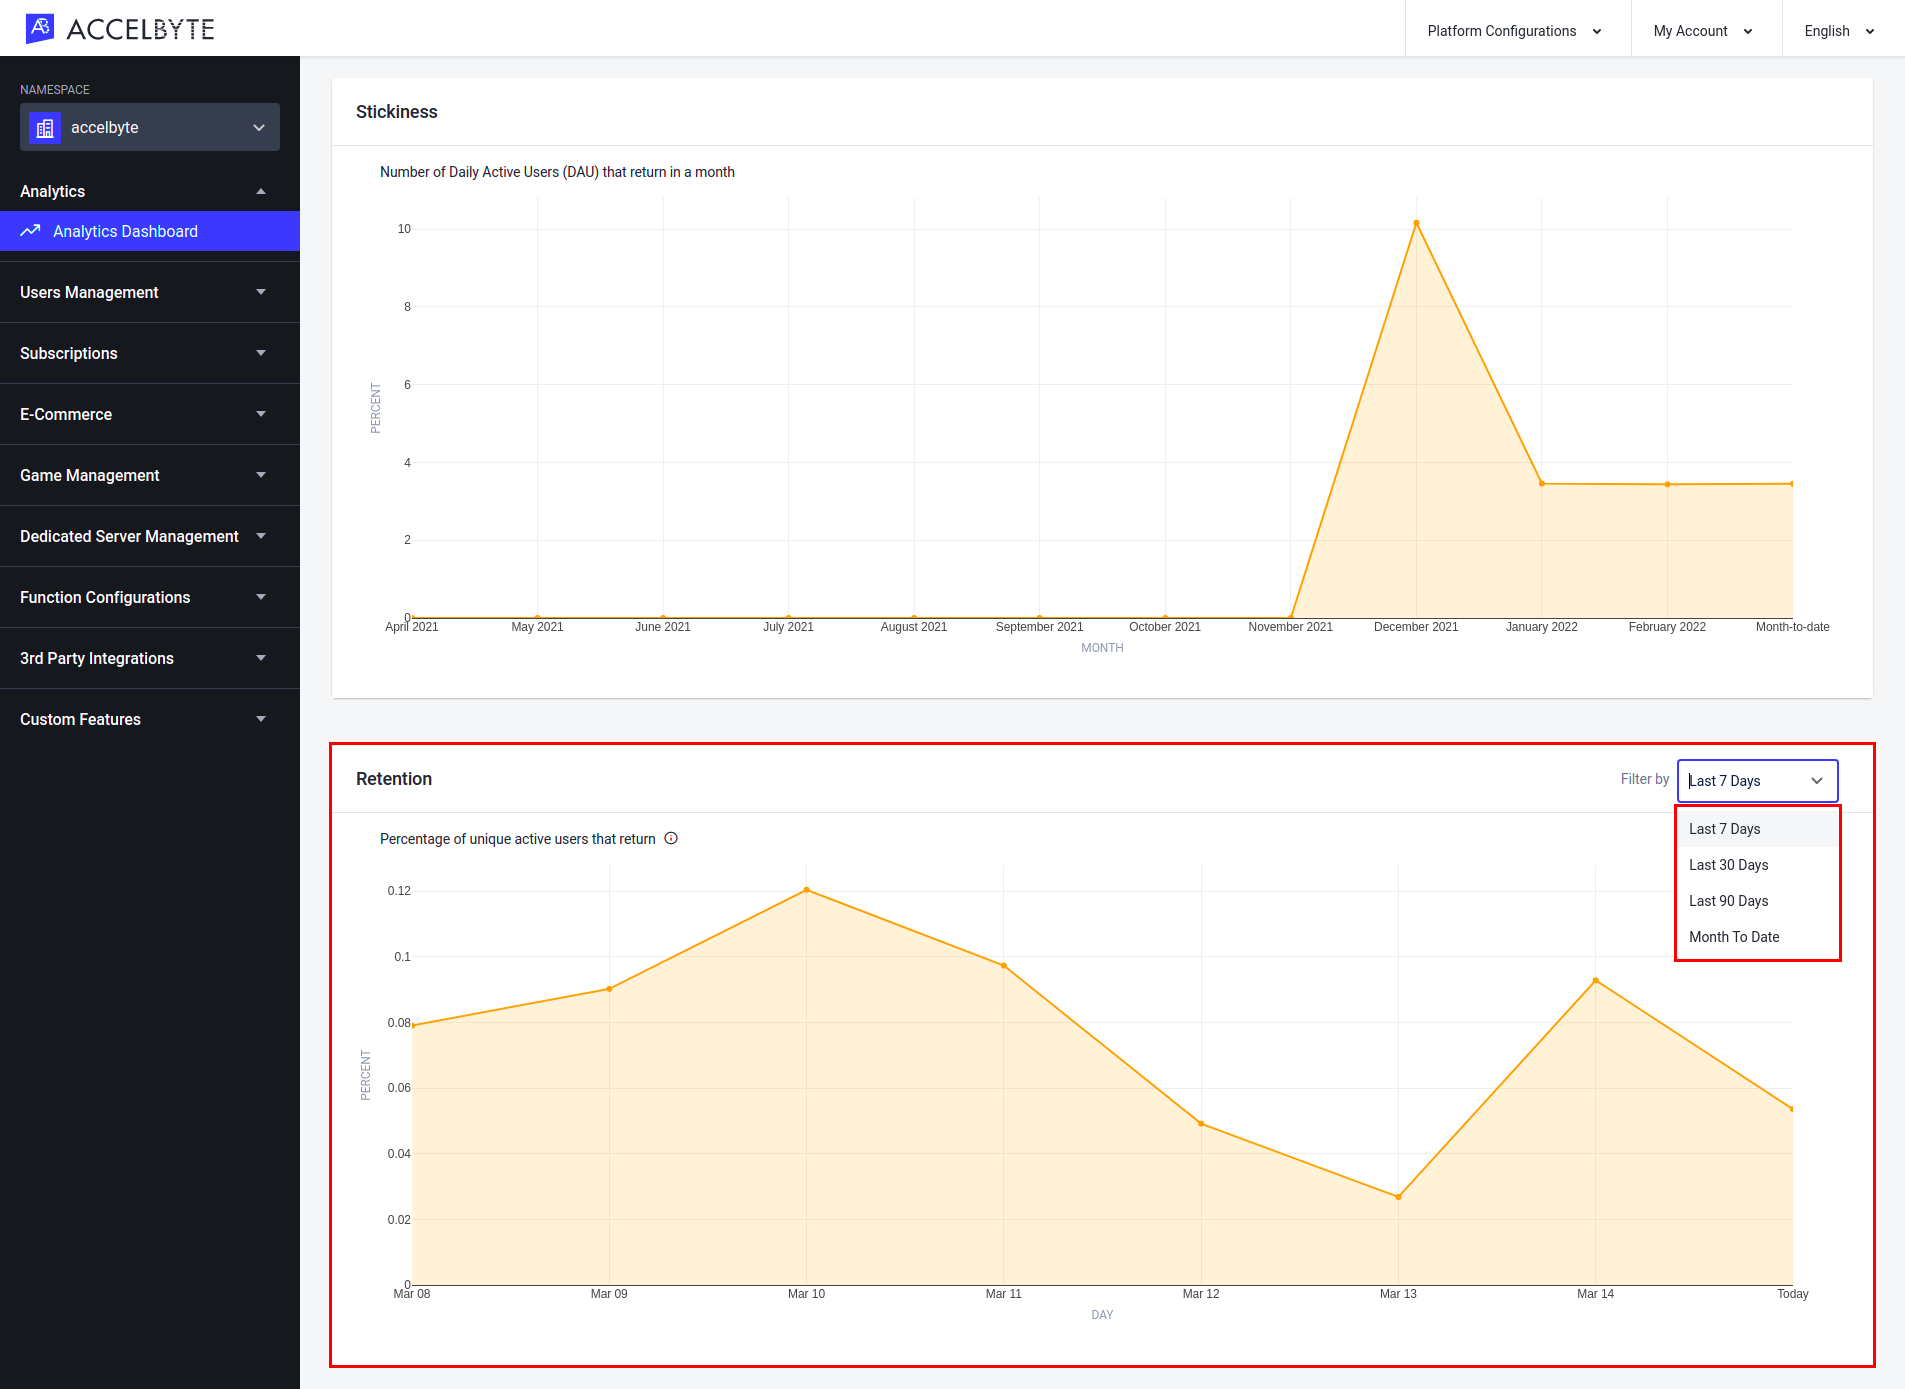
Retention
The Retention line graph in the Retention tab shows the percentage of active players on a particular day that were also active the previous day, over the last 7, 30, or 90 days, or in the current month. You can switch between these options by selecting Last 24 Hours, Last 7 Days, Last 30 Days, or Month to Date from the dropdown menu in the top-right corner of the panel.
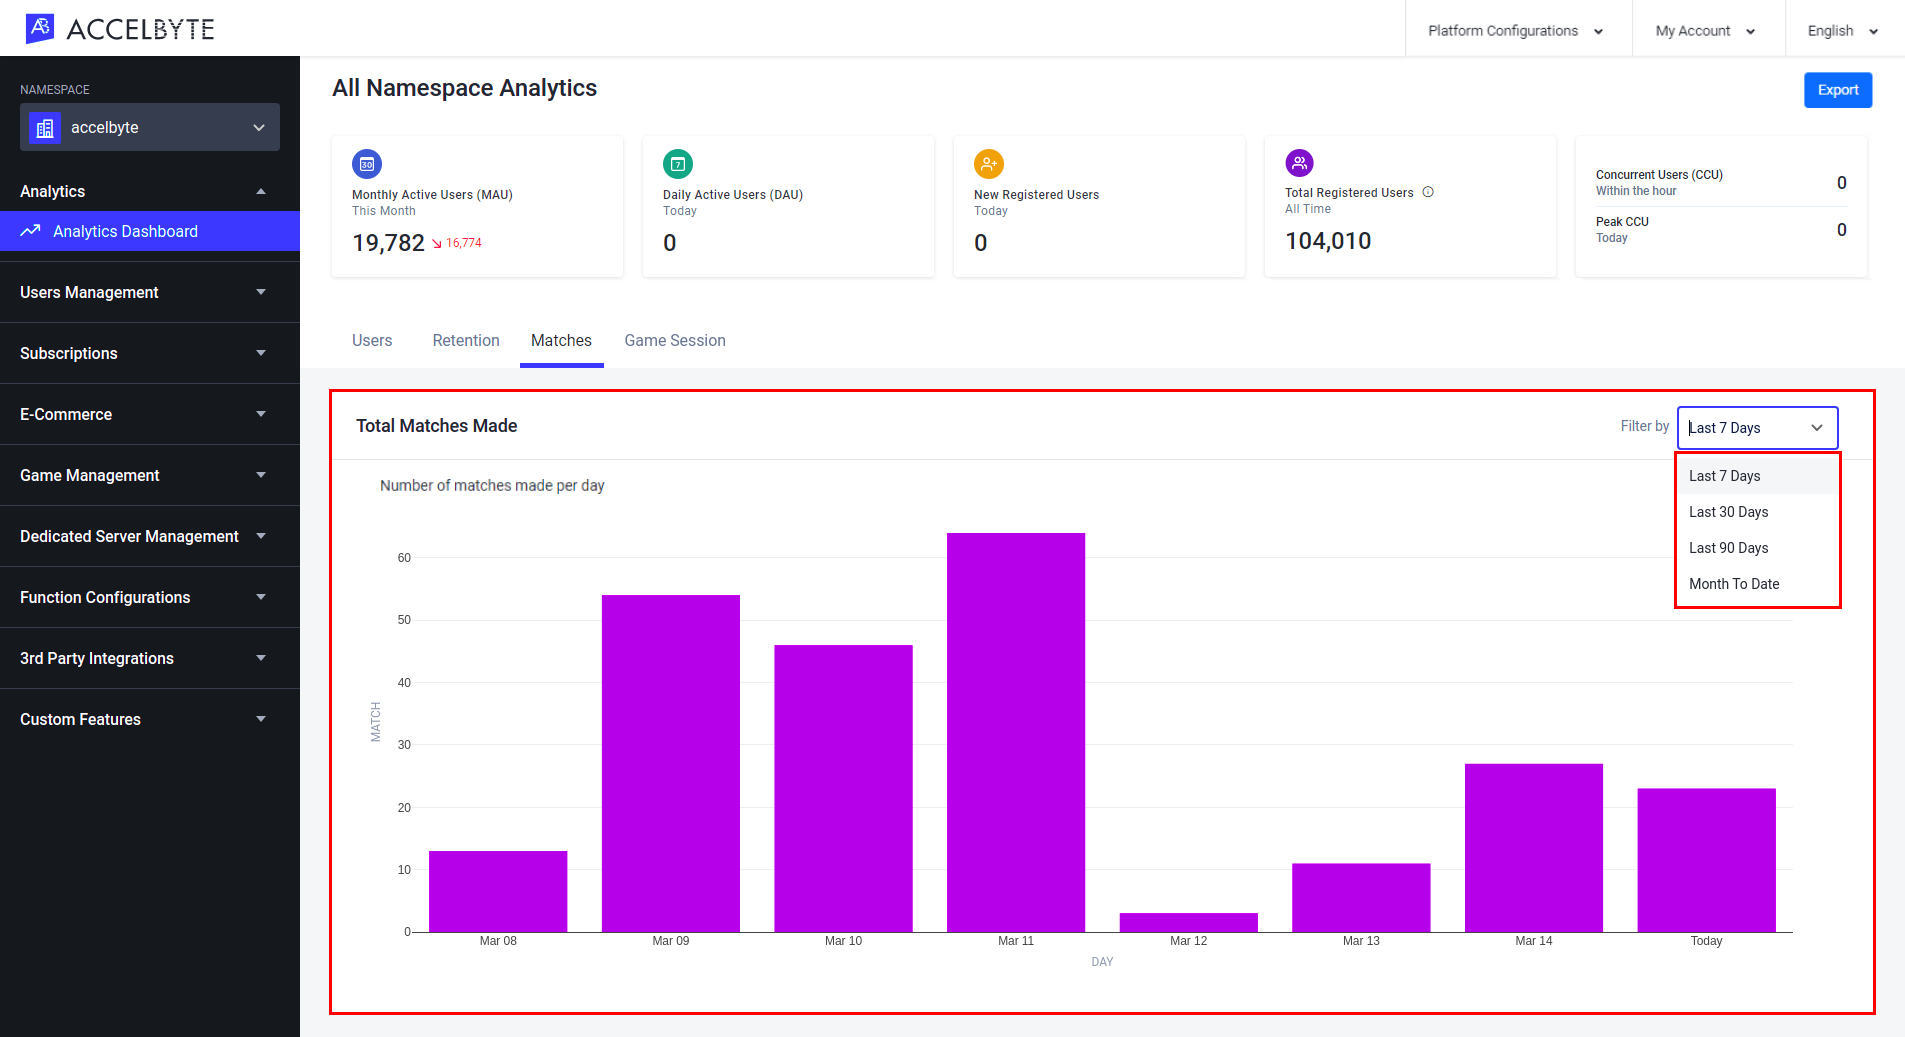
Total Matches Made
The Total Matches Made bar graph in the Matches tab shows how many matches were made each hour of the last 24 hours, each day of the last 7 or 30 days, or each day of the current month. You can switch between these options by selecting Last 24 Hours, Last 7 Days, Last 30 Days, or Month to Date from the dropdown menu in the top-right corner of the panel.
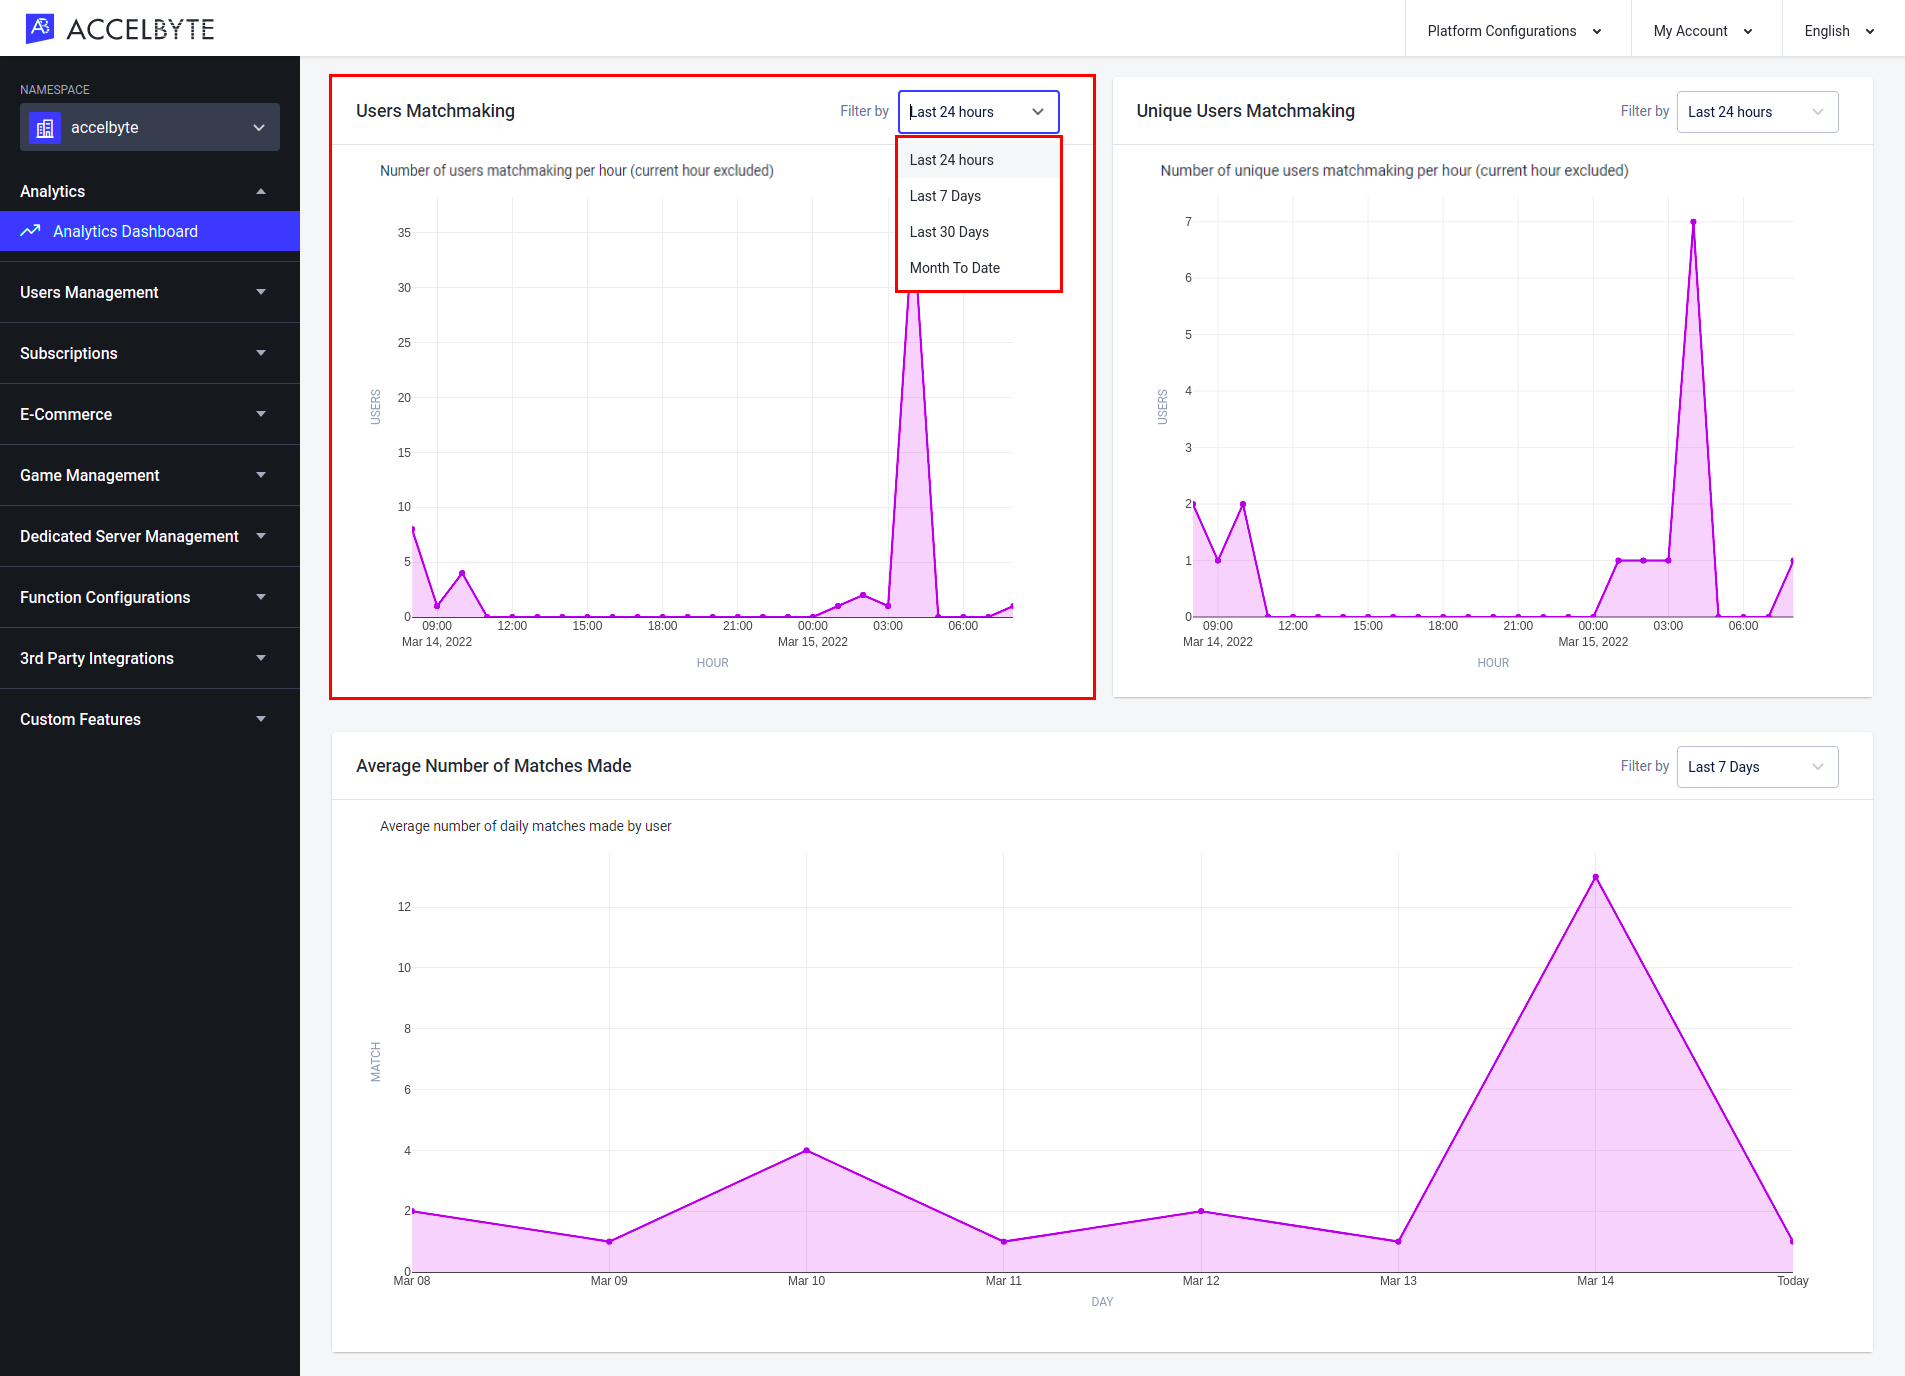
Users Matchmaking
The Users Matchmaking line graph in the Matches tab shows the total number of players in matches each hour from the last 24 hours, the last 7 or 30 days, or in the current month. You can switch between these options by selecting Last 24 Hours, Last 7 Days, Last 30 Days, or Month to Date from the dropdown menu in the top-right corner of the panel.
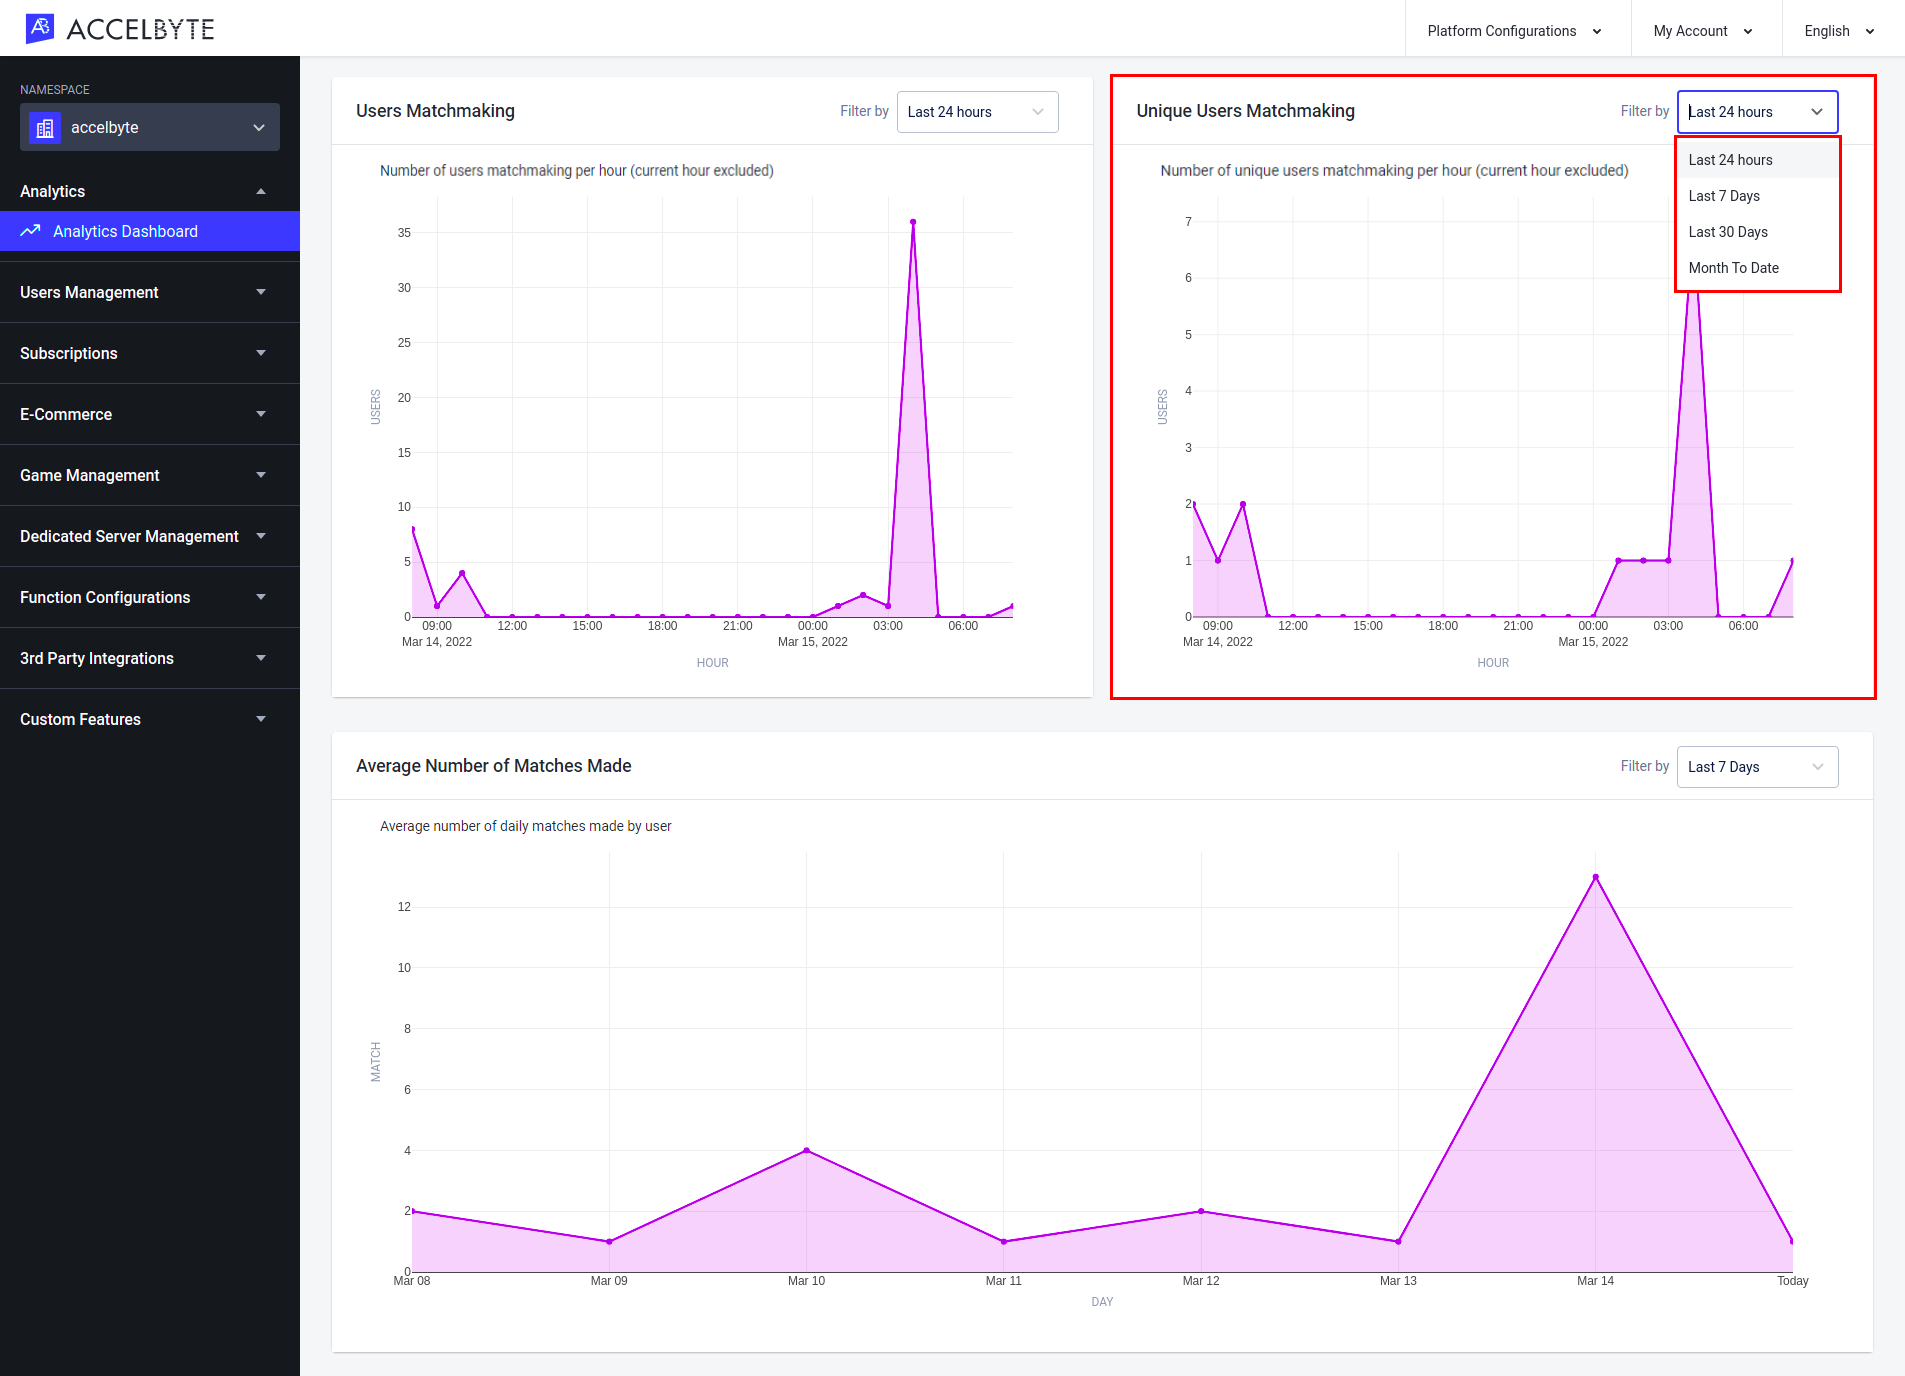
Unique Users Matchmaking
The Unique Users Matchmaking line graph in the Matches tab shows the total number of unique players in matches each hour from the last 24 hours, the last 7 or 30 days, or in the current month. You can switch between these options by selecting Last 24 Hours, Last 7 Days, Last 30 Days, or Month to Date from the dropdown menu in the top-right corner of the panel.
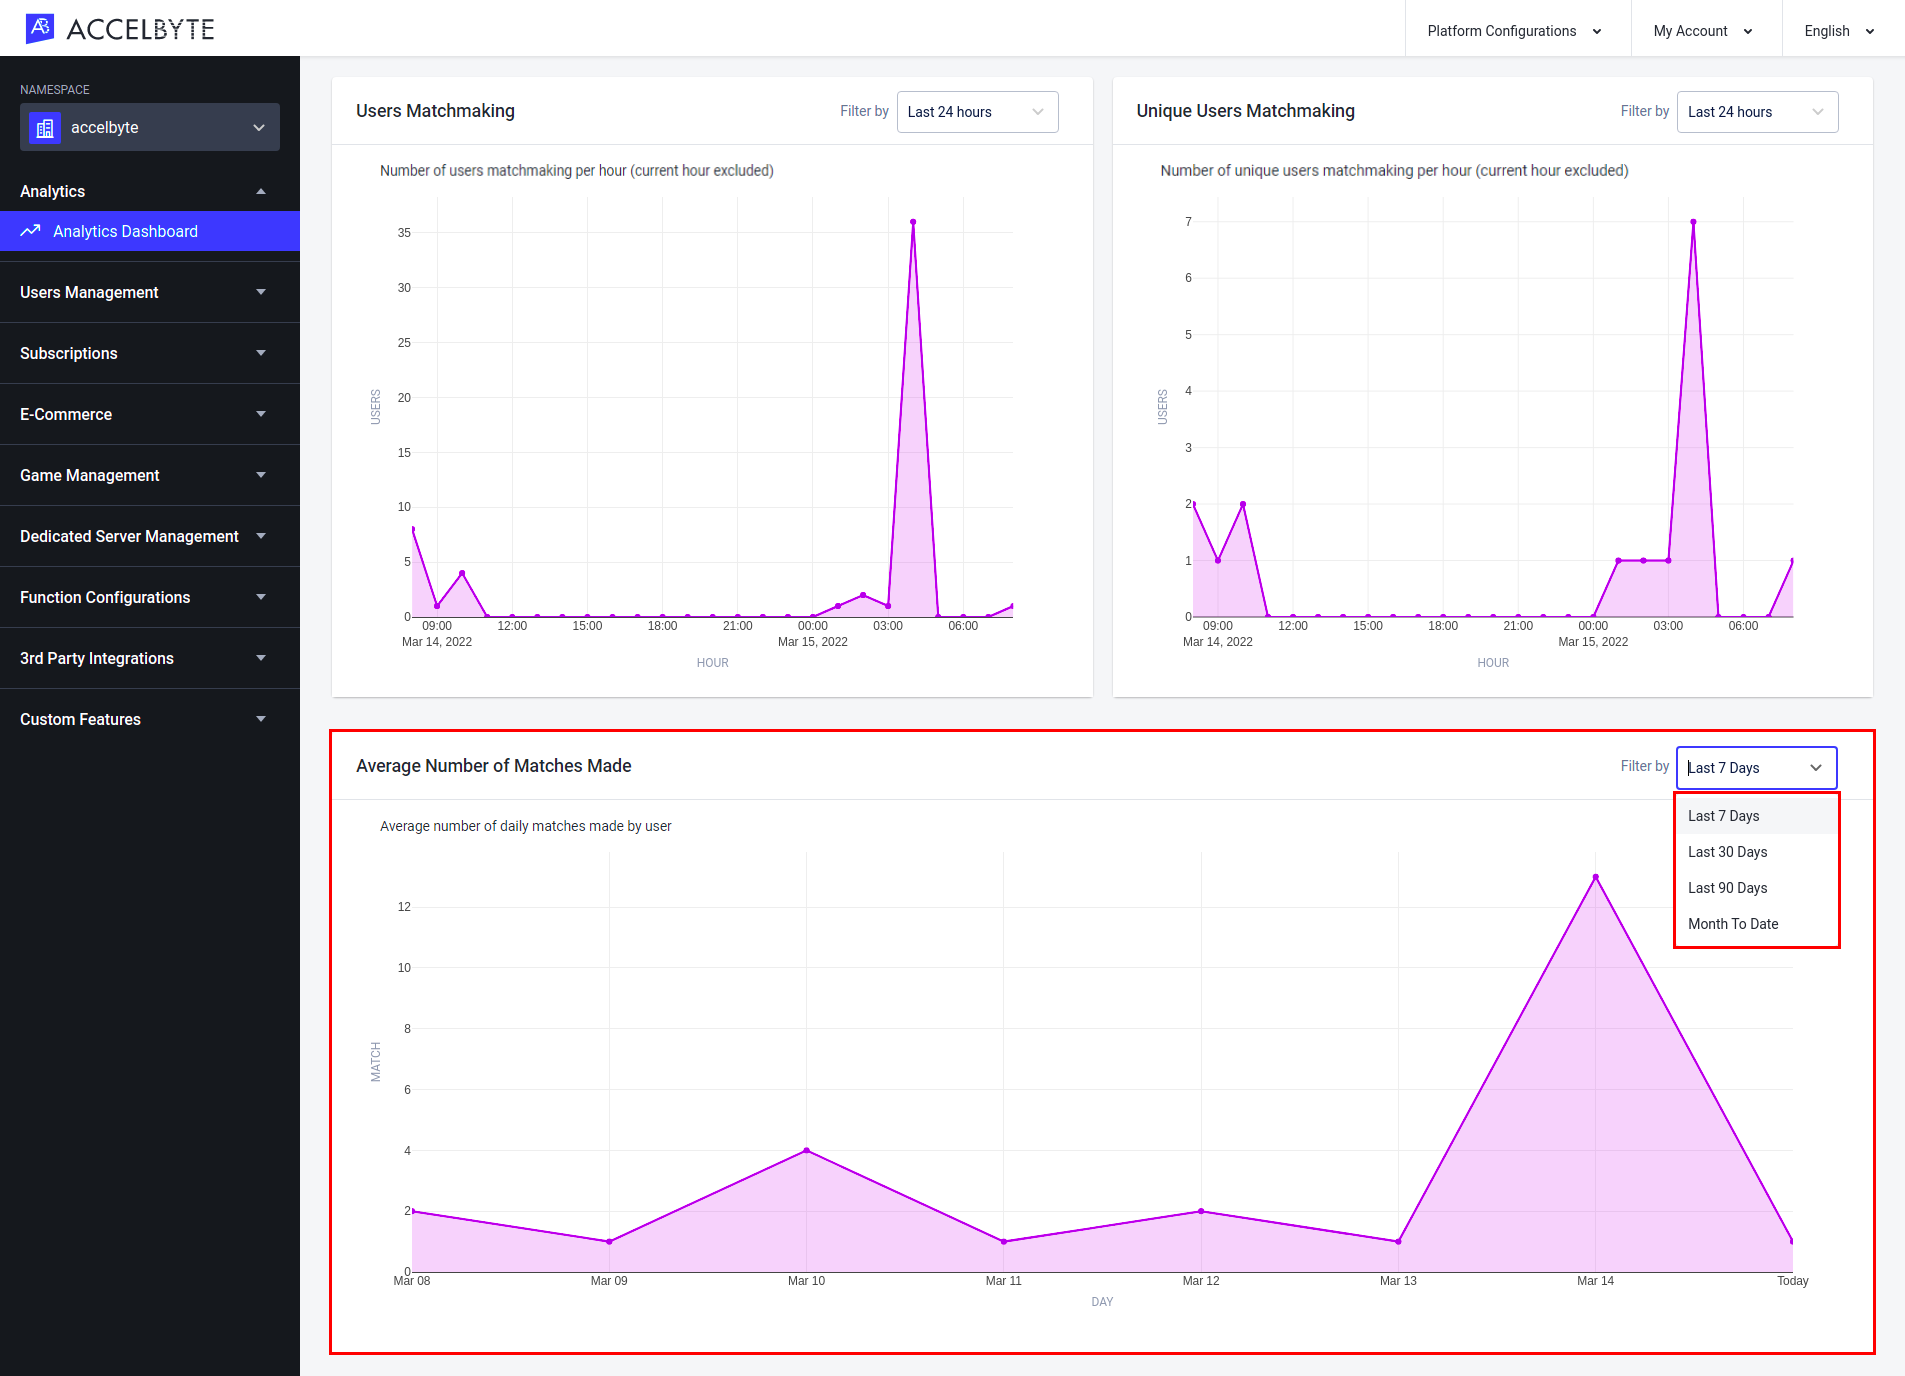
Average Number of Matches Made
The Average Number of Matches Made line graph in the Matches tab shows the average number of players in matches each day of the last 7, 30, or 90 days, or of the current month. You can switch between these options by selecting Last 7 Days, Last 30 Days, Last 90 Days, or Month to Date from the dropdown menu in the top-right corner of the panel.
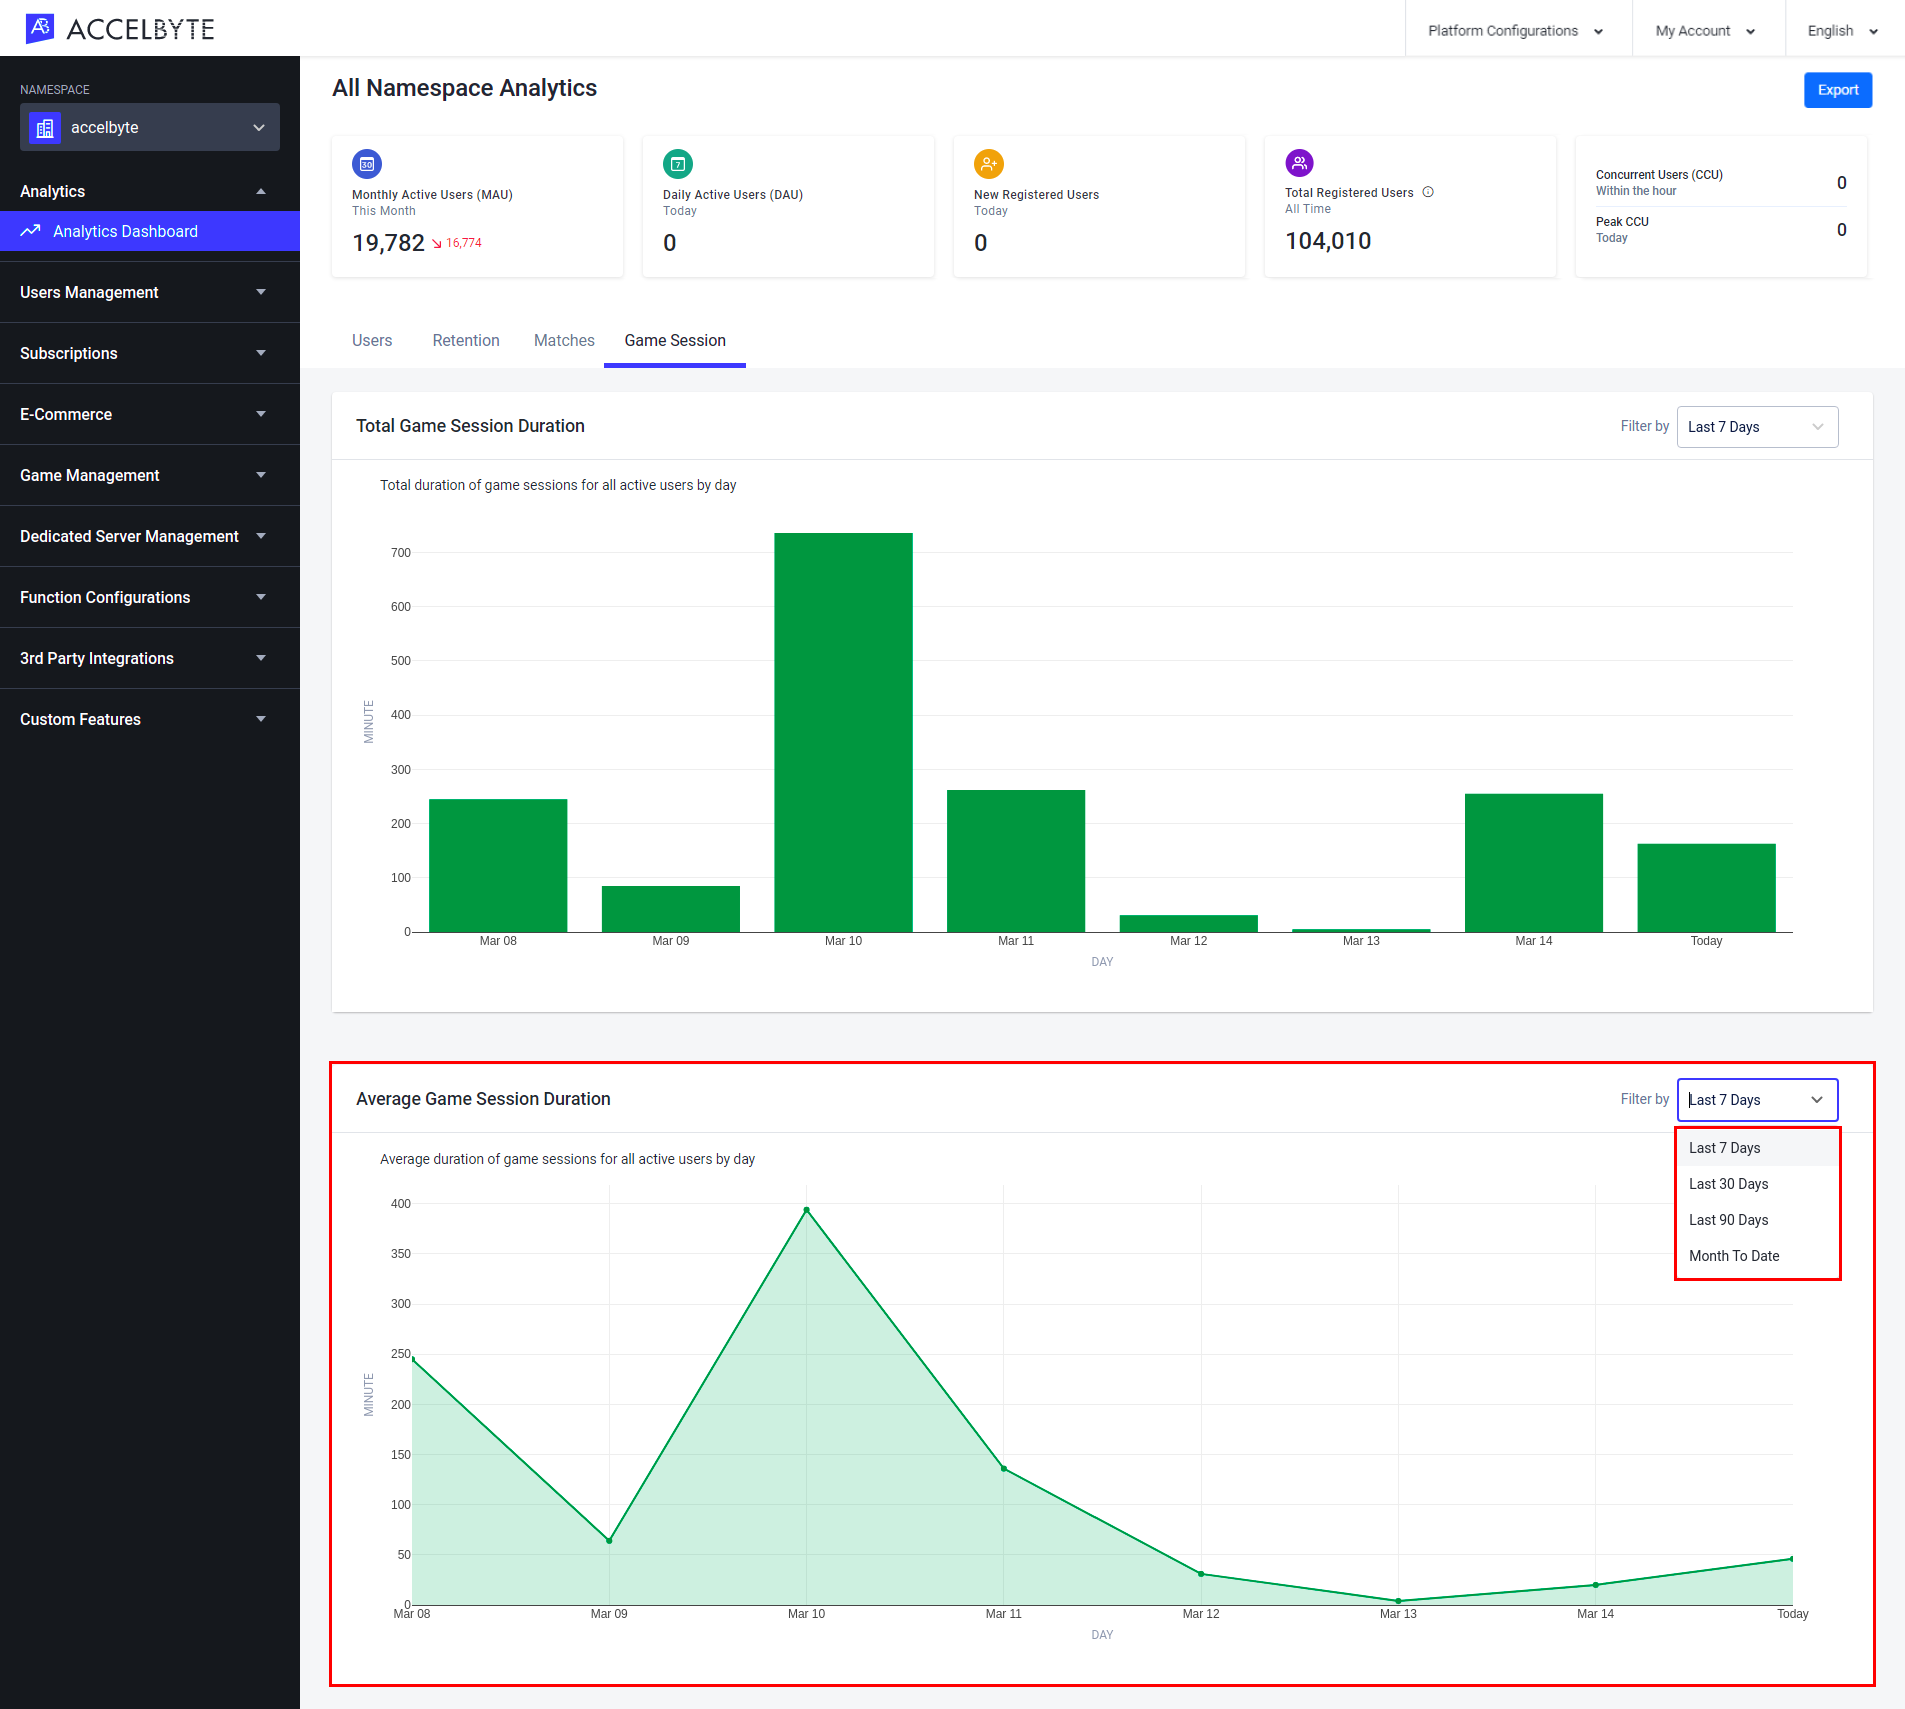
Total Game Session Duration
The Total Game Session Duration bar graph in the Game Sessions tab shows the total gameplay time for all players in minutes per day for the last 7, 30, or 90 days, or for the current month. You can switch between these options by selecting Last 7 Days, Last 30 Days, Last 90 Days, or Month to Date from the dropdown menu in the top-right corner of the panel.

Average Game Session Duration
The Average Game Session Duration line graph in the Game Sessions tab shows the average session length in minutes per day for the last 7, 30, or 90 days, or for the current month. You can switch between these options by selecting Last 7 Days, Last 30 Days, Last 90 Days, or Month to Date from the dropdown menu in the top-right corner of the panel.
Manage the Analytics Dashboard in the Admin Portal
Enable Testing Mode
Testing Mode can be used to keep testing data out of the analytics pipeline. To enable testing mode, follow the steps below:
NOTE
This feature in disabled on Admin Portal by Default. You can contact us to enable this feature on your admin portal
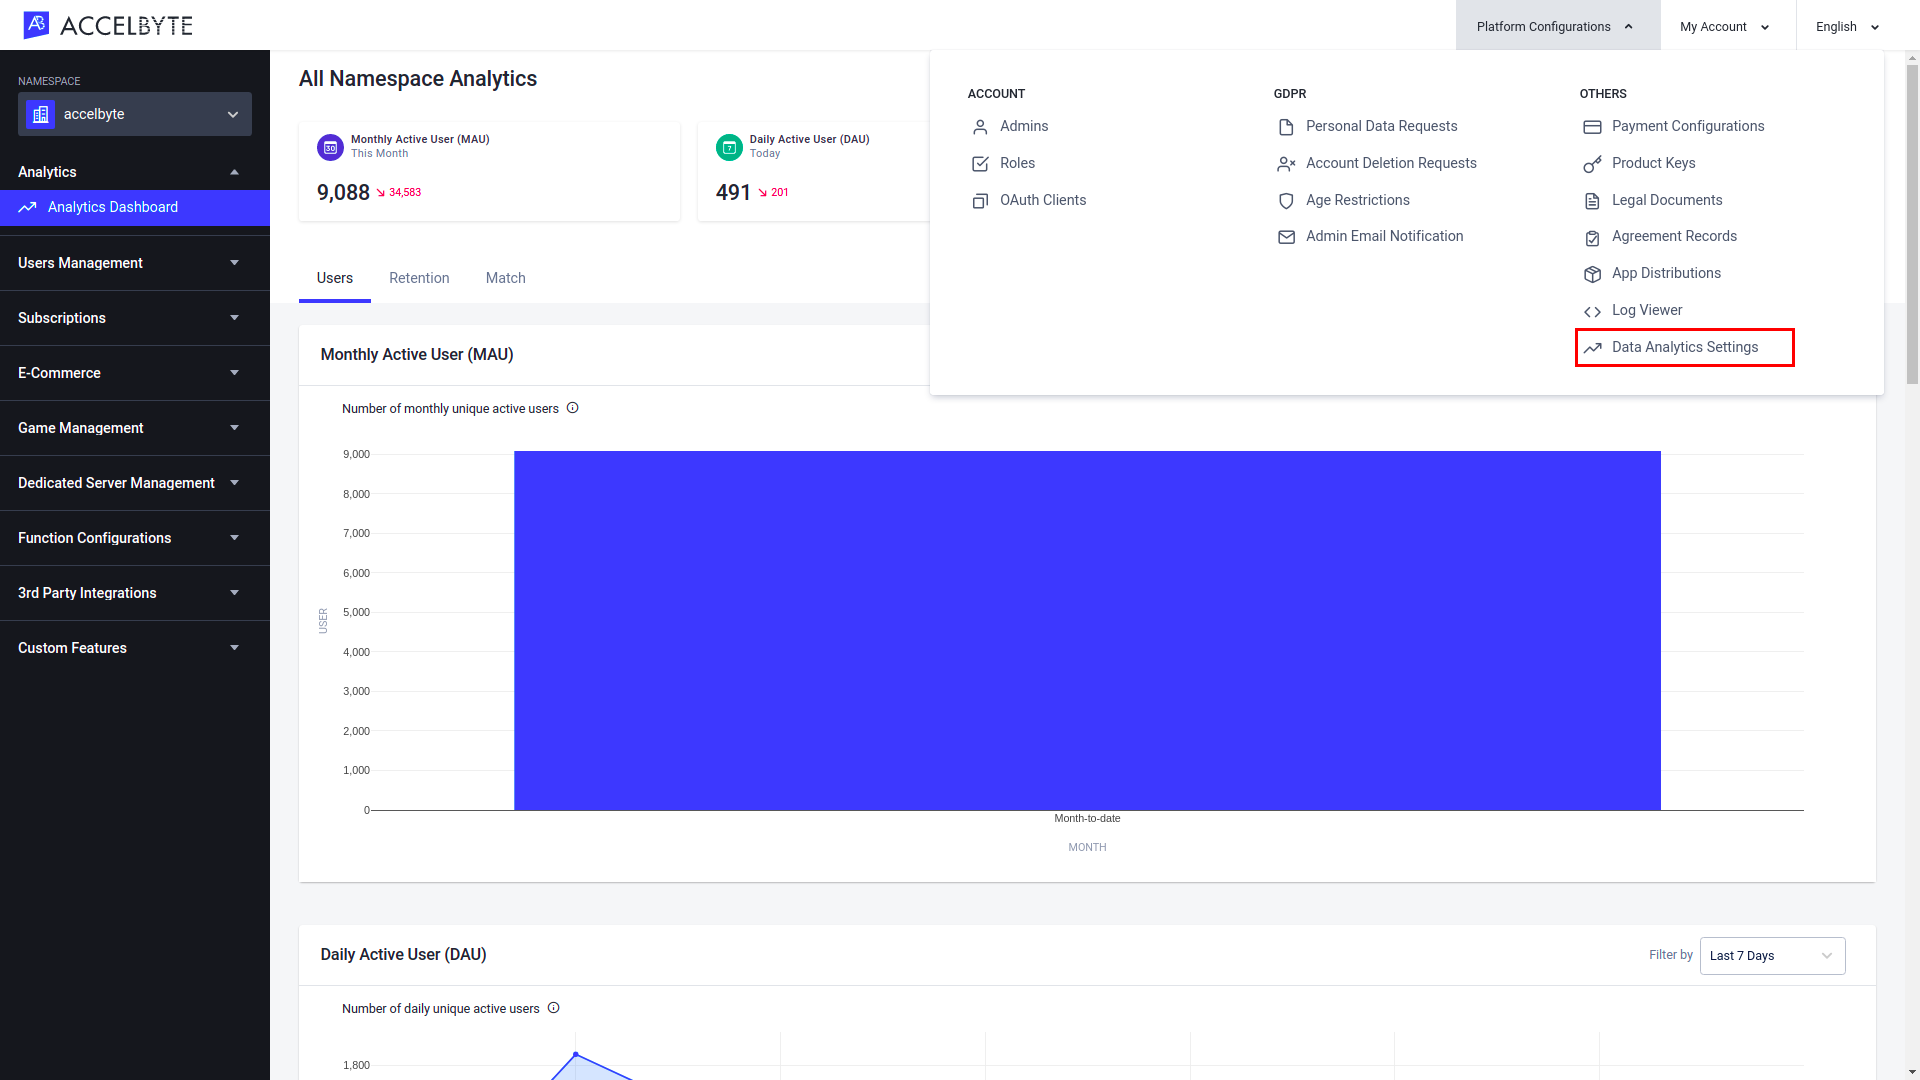
On the All Namespace Analytics page, open the Platform Configurations menu in the top-right corner of the screen, then select Data Analytics Settings.
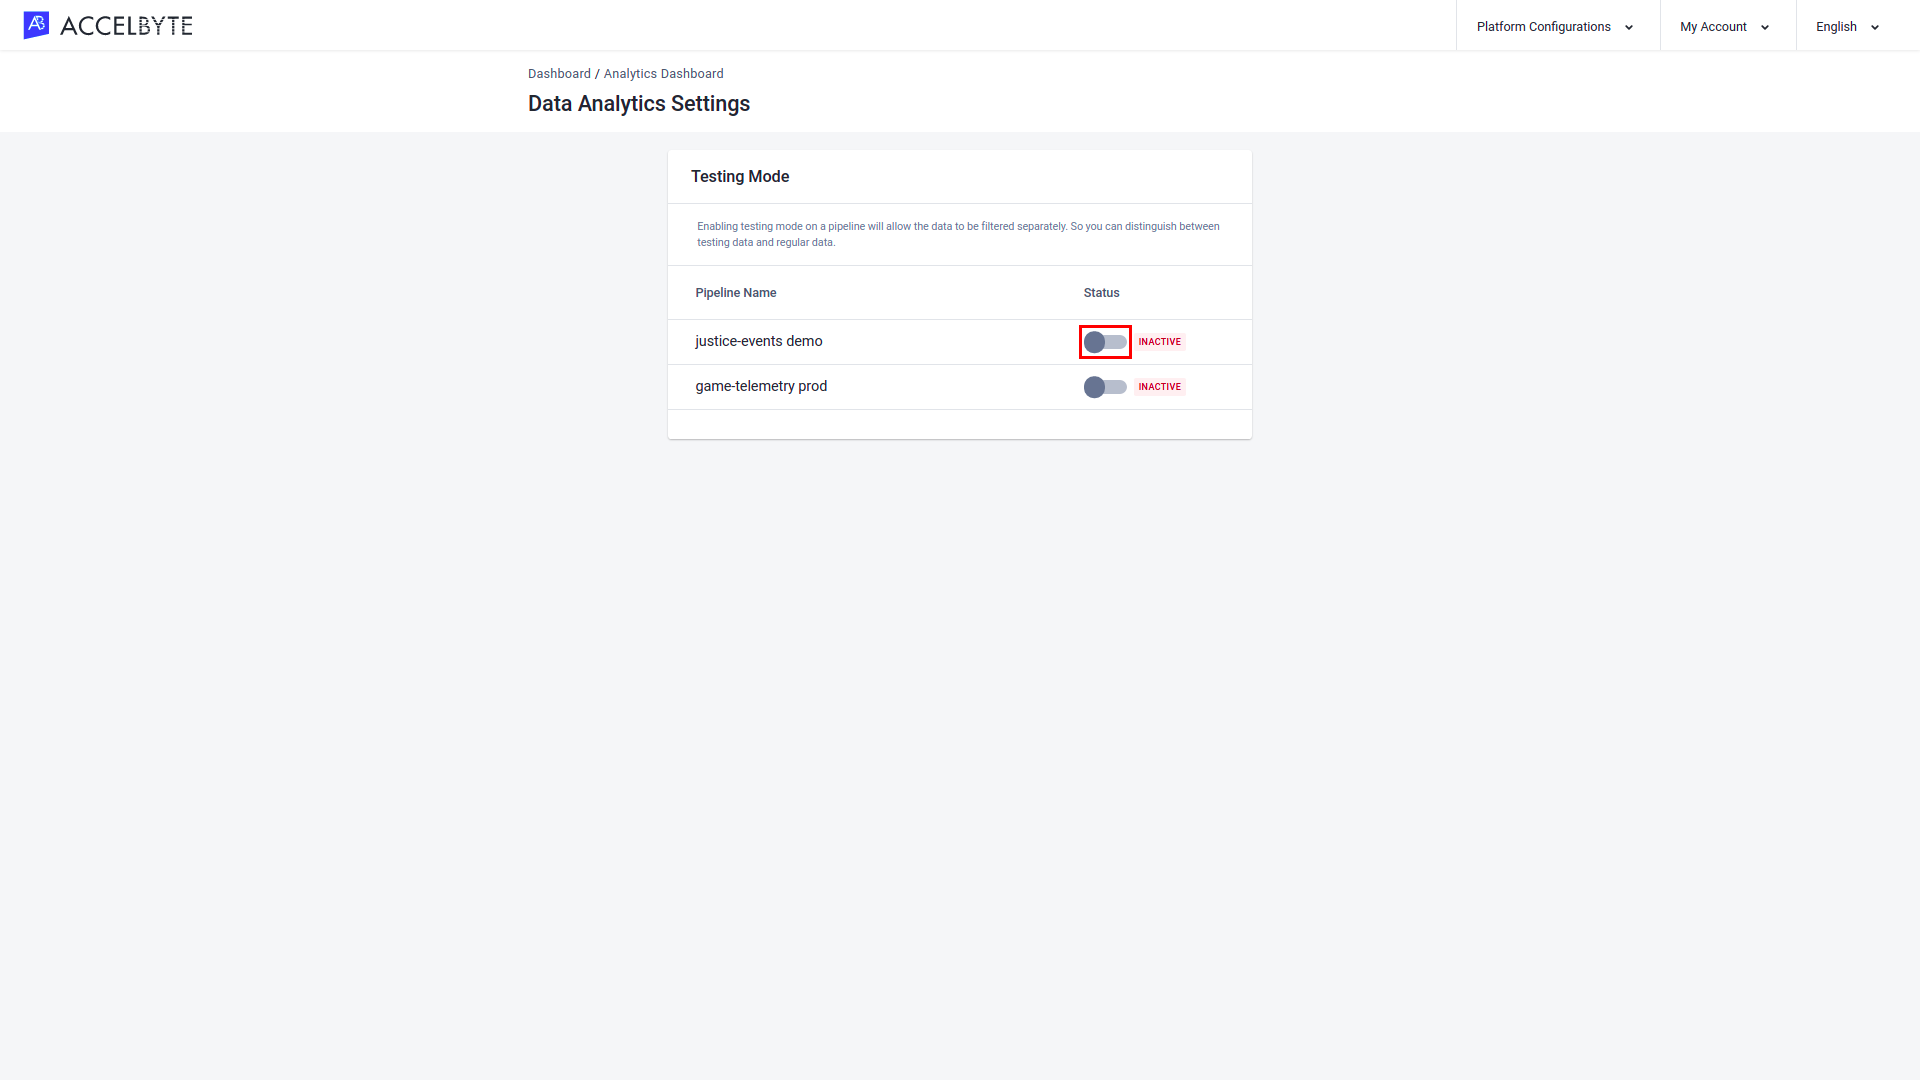
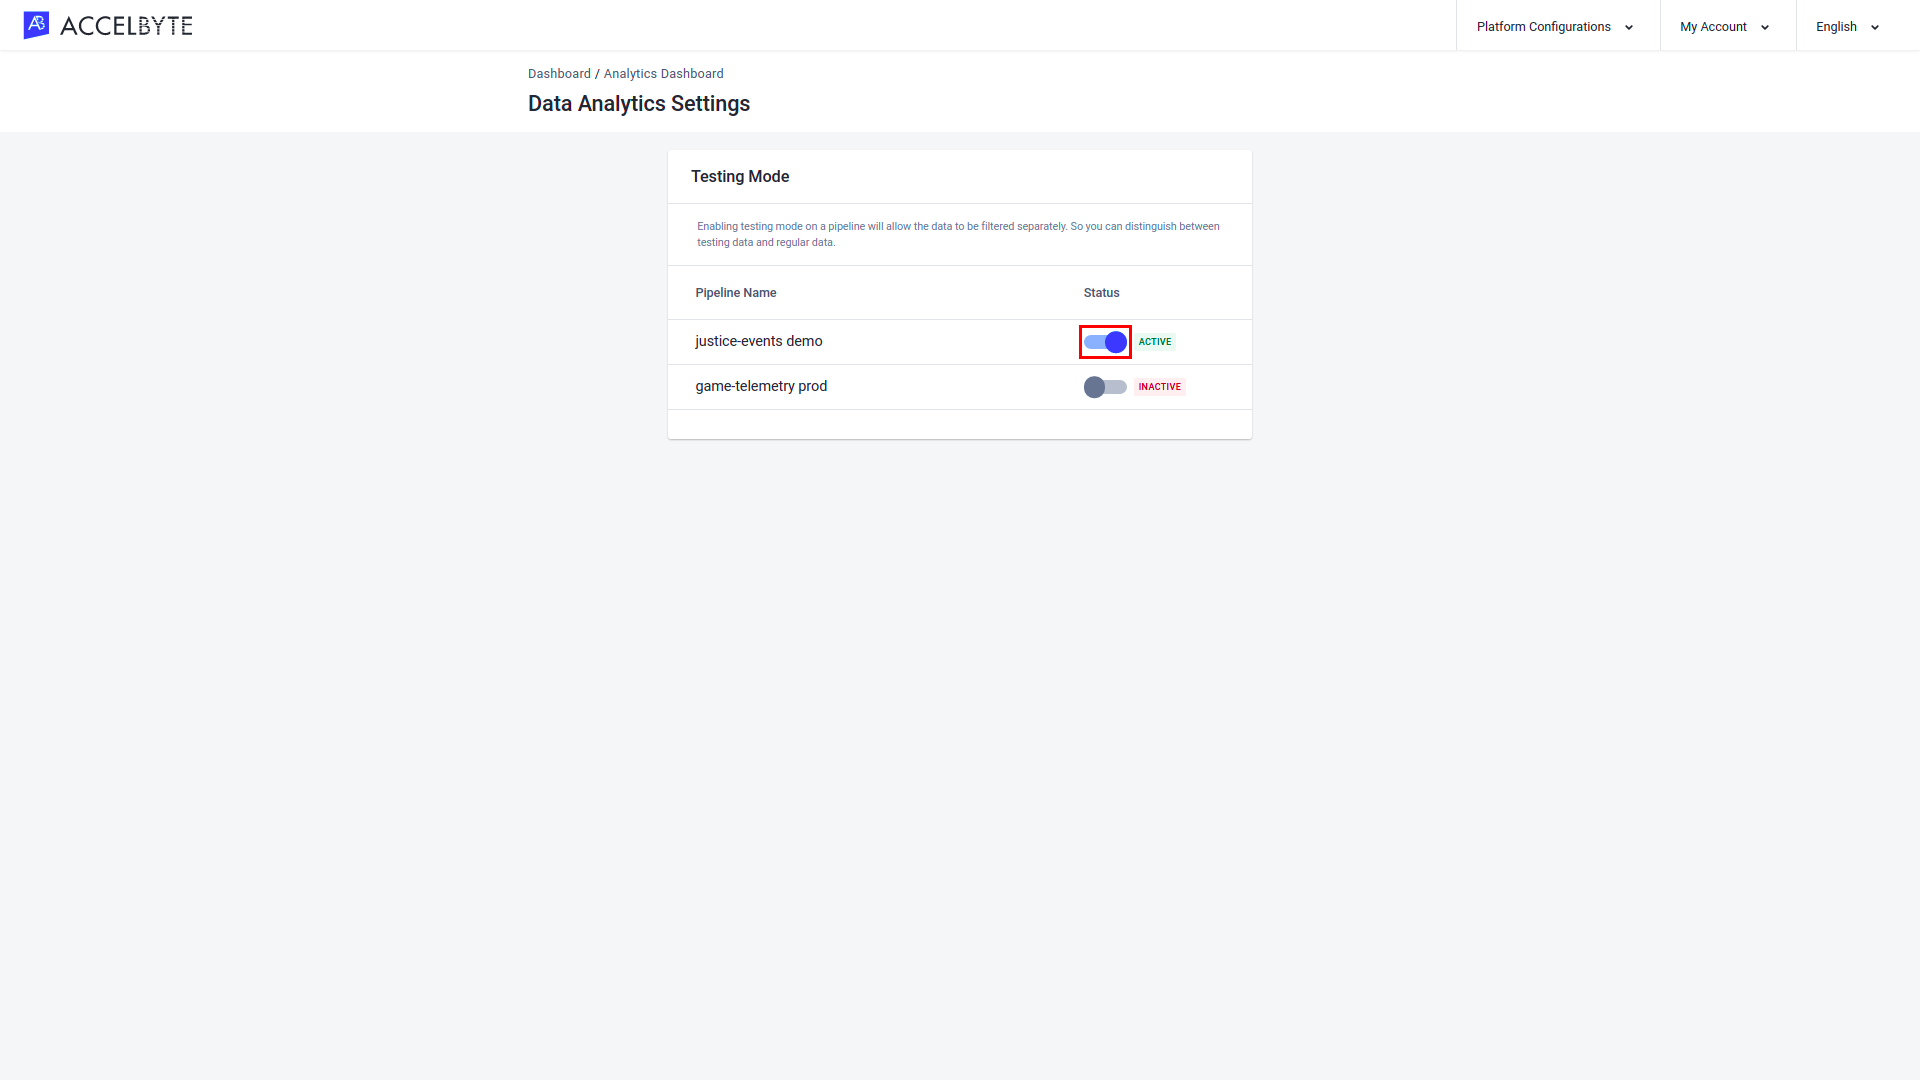
The Data Analytics Settings page lists all the telemetry pipelines that you have set up in your environment. Toggle the pipeline on which you want to enable testing mode.
The Enable Testing Mode confirmation box will appear. Click Enable.
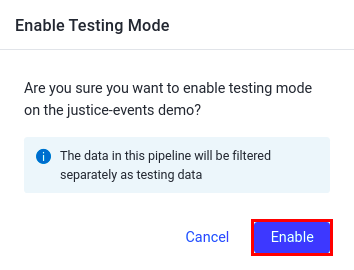
Testing Mode is now enabled. To disable testing mode, toggle the Status switch again.
Export Analytics Data
On the All Namespace Analytics page, click the Export button.

The Export Analytics Data form appears. Fill in the Date Range field with the time period of analytics data you want to export, with maximum range in 6 month.
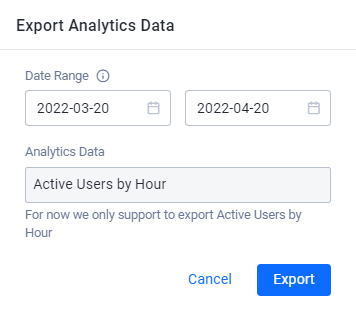
NOTE
We currently only support exporting Active Users by Hour data.